
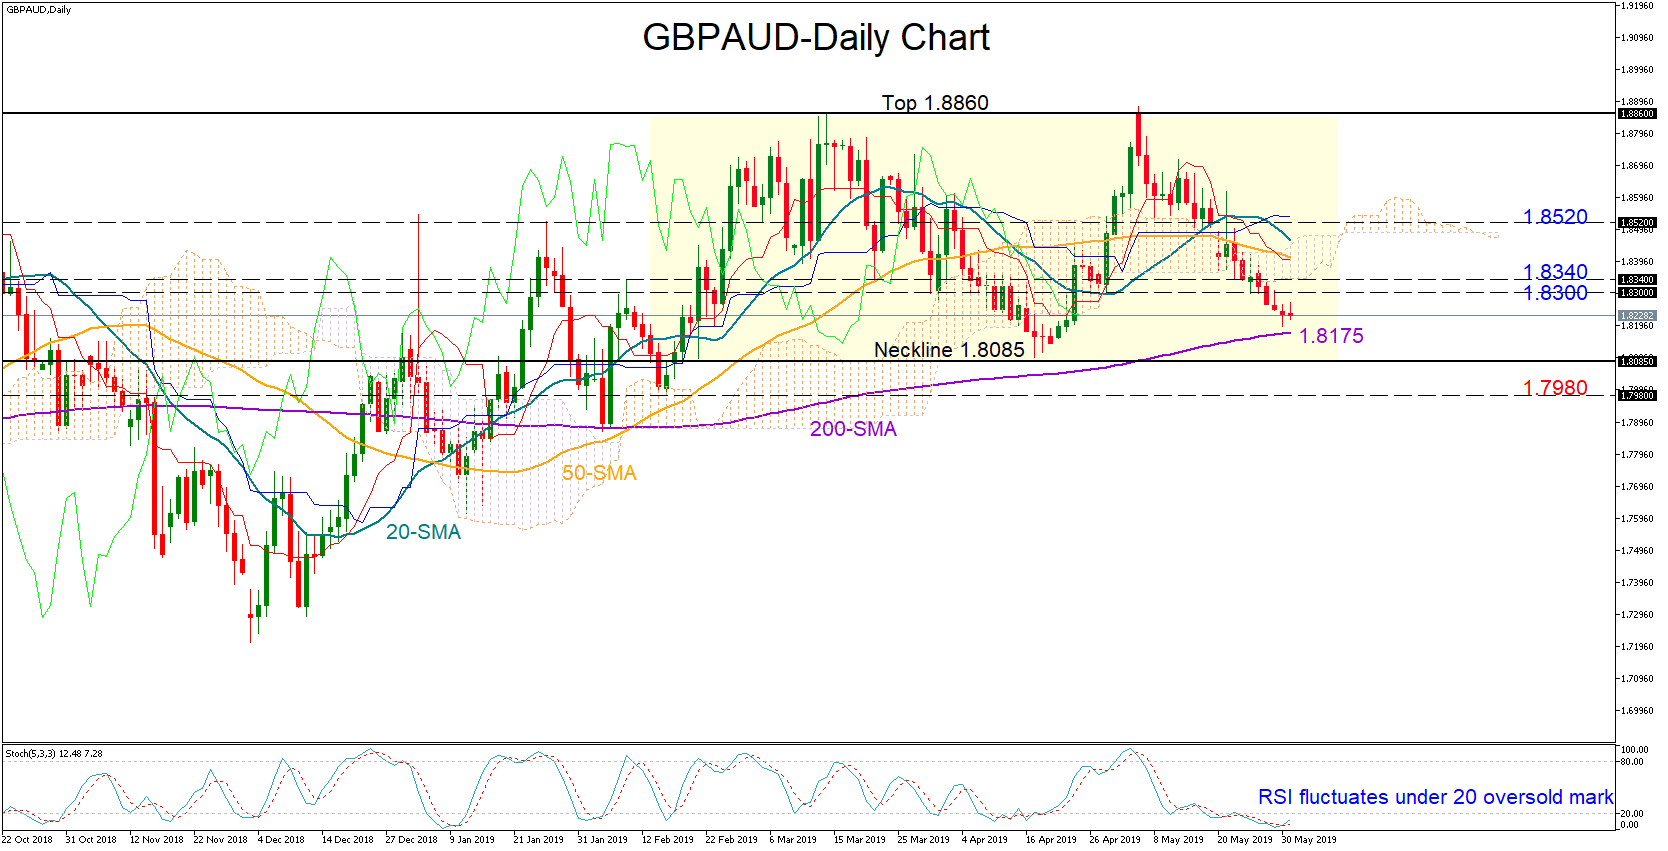
GBPAUD has been in a congestion zone since mid-February, in what has started to look like a double top formation. The price, however, needs to break below the neckline positioned around 1.8095 to confirm the bearish pattern but with Stochastics warning over an oversold market, such a move may come with a delay.
The 200-day simple moving average (SMA) currently at 1.8175 could halt downside movements ahead of the neckline. Crossing under the 1.8085 support area, the sell-off could turn more aggressive, with the bears probably targeting the 1.7980 number next.
Should the market change direction to the upside, resistance could initially emerge between 1.83-1.8340. Even higher, a rally above the Ichimoku cloud and more importantly above the strong barrier of 1.8520 could extend upside momentum.
Meanwhile in the medium-term picture, the pair remains neutral as long as it trades within the 1.8860-1-8085 region. The negative slope in the 50-day SMA reduces chances for a more positive outlook.
In brief, GBPAUD looks bearish and oversold in short-term, while in the medium-term it holds a neutral profile.


