
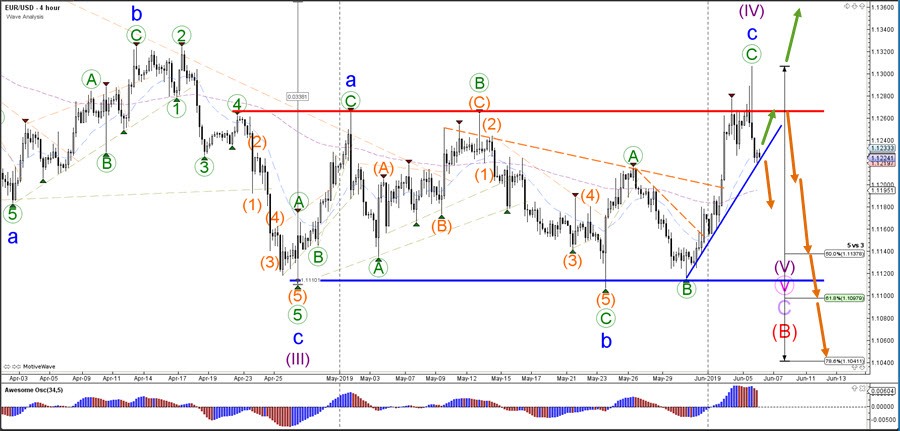
The EUR/USD daily chart is showing a strong bearish candlestick pattern but a break below the support trend line (blue) is needed as a confirmation for more downside. A bullish bounce could see price retest the resistance zone (red line) first, which could act as a head and shoulders level on the lower time frame as well. Price must break above the 1.1310-1.1325 resistance zone before an uptrend is possible (green arrow).
The EUR/USD could test the Fibonacci retracement levels of wave 2 vs 1. Especially the 61.8% Fib level could be a strong resistance area due to the potential head and shoulders reversal chart pattern. A bearish bounce and break below the support line (blue) would confirm the bearish wave pattern whereas a break above the 100% Fib level indicates an uptrend.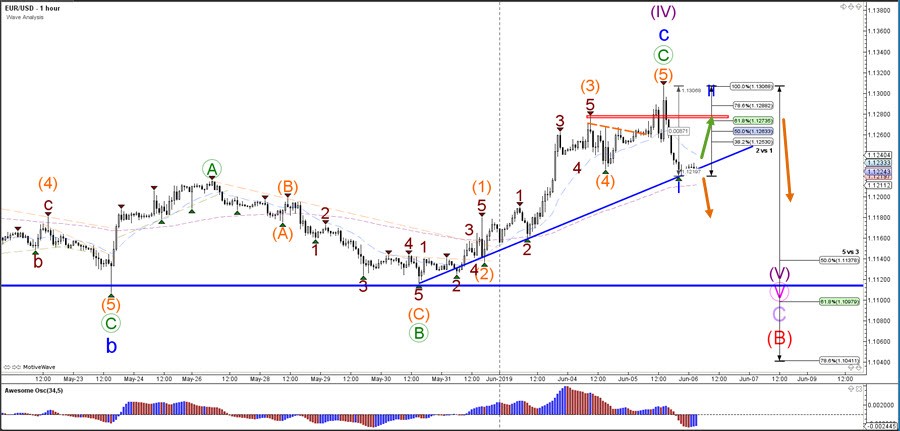


