
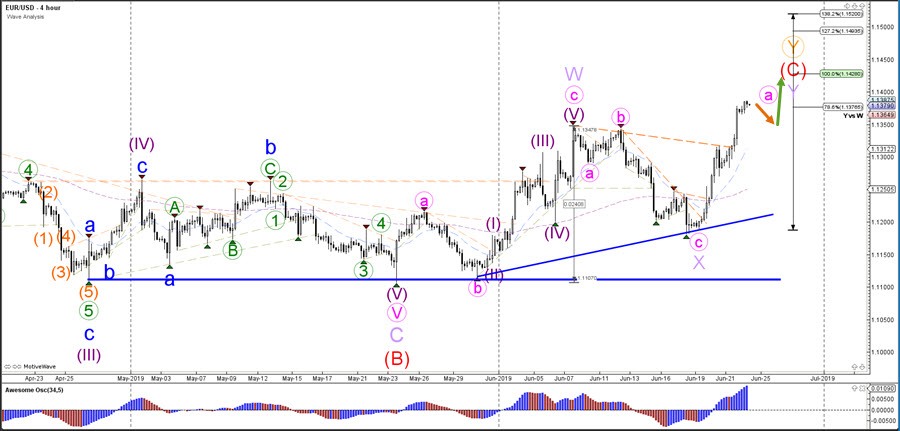
The EUR/USD seems to be building a bullish correction via wave A (pink) of a larger wave Y (orange). The Fibonacci levels are the main targets for the upside. Eventually price is expected to build a bearish correction within wave B (pink).
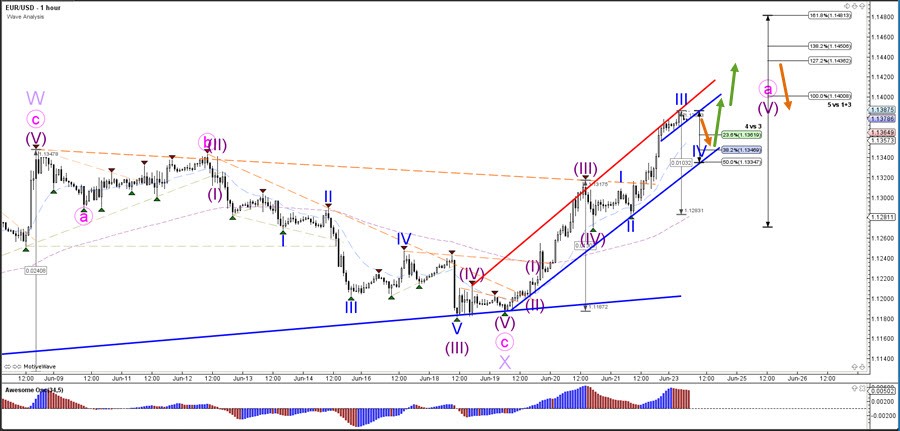
break below the support trend line (blue) indicates that the bears remain in control and could start a drop towards the 78.6% and 88.6% levels of wave 2 vs 1. A larger downtrend, however, only is confirmed once price breaks and closes (on daily chart) below the critical 1.11 support. A break above the resistance trend line (red) indicates a bullish breakout and potentially the end of the 2 (pink) retracement.


