
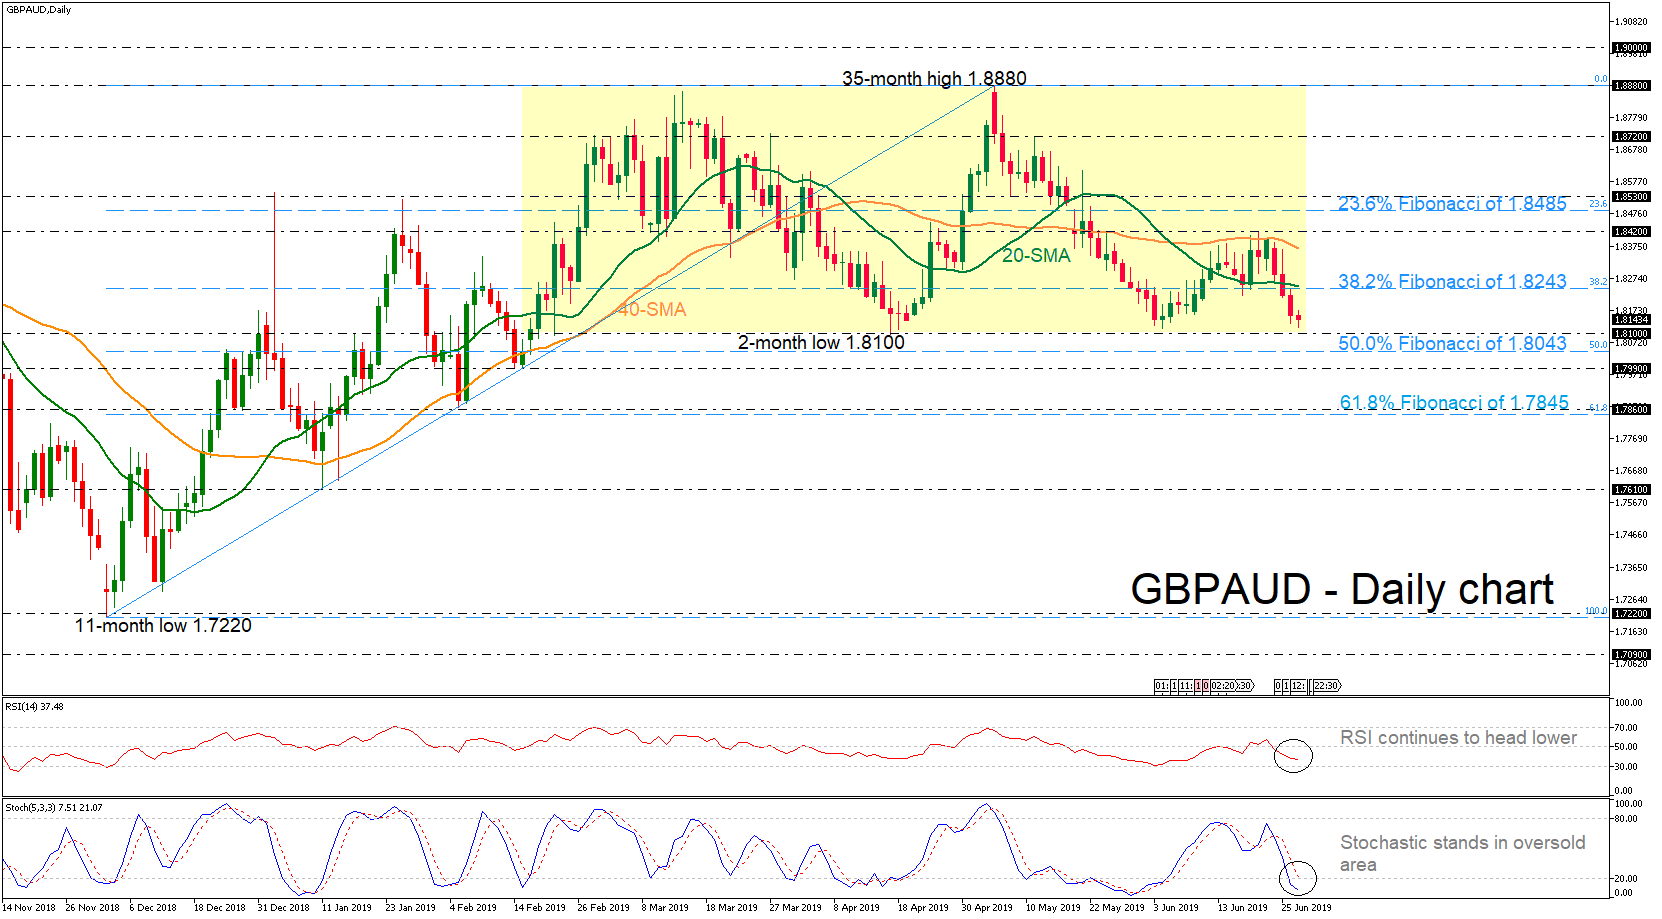
GBPAUD is posting red days, hovering around the lower boundary of the trading range (1.8100 – 1.8880), which has been standing since February 19. The RSI is pointing down in the negative territory, while the stochastic is holding in the oversold area.
Should the market continue its downside direction and penetrate the range, support could initially emerge between 1.8100-1.8043, which overlaps with the 50.0% Fibonacci of the upleg from 1.7220 – 1.8880. Even lower, a rally could find an obstacle at the 1.7990 region and at the 61.8% Fibonacci of 1.7845.
Alternatively, the 20-day simple moving average (SMA) near the 38.2% Fibonacci of 1.8243 could halt upside movements ahead of the 40-day SMA at 1.8365. Crossing above this area, the buying interest could turn more aggressive, with the bulls probably targeting the 23.6% Fibonacci near 1.8485.
Concluding, investors should wait to see a drop below 1.8100 for bearish actions or a climb above 1.8880 for bullish orders.


