Contributors Technical Analysis EUR/USD Triangle Pattern Favors Bearish Swing To 1.1275

EUR/USD Triangle Pattern Favors Bearish Swing To 1.1275

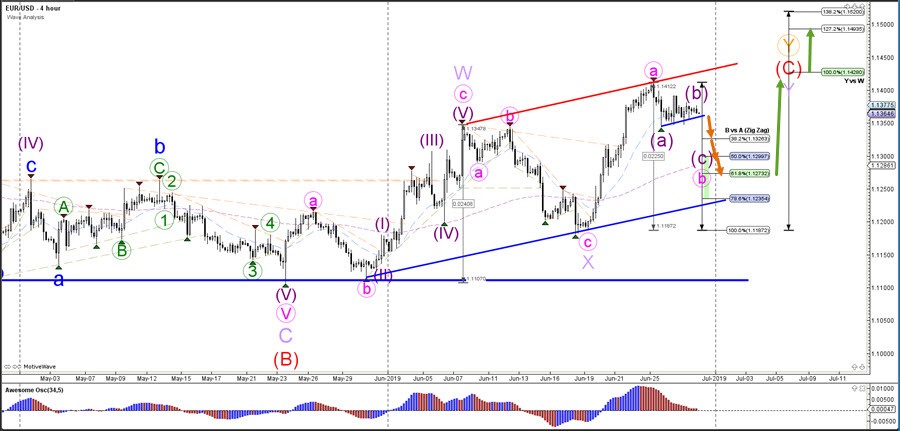
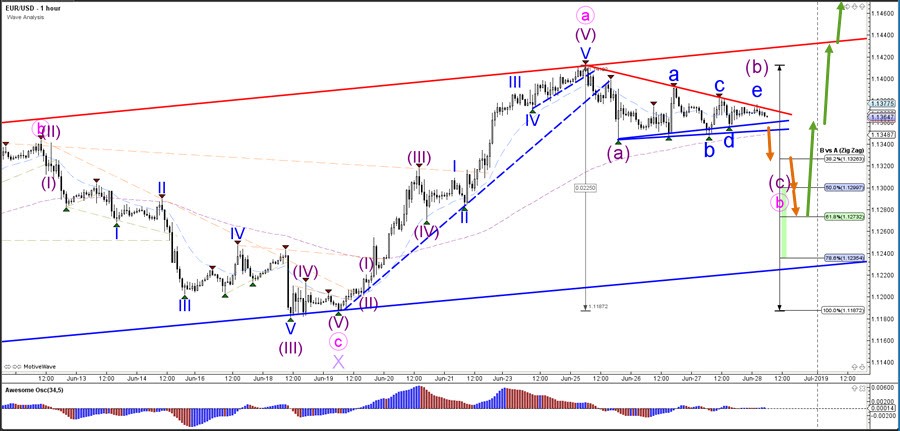
The EUR/USD bullish swing has most likely completed a strong, impulsive wave A (pink) and price is expected to show another bullish swing after completing a bearish ABC retracement (purple). The Fibonacci levels of wave B vs A are therefore expected to act as potential support level for a bullish reversal.

The EUR/USD seems to have completed an ABCDE (blue) triangle chart pattern within wave B (purple). For the moment, a bearish breakout seems more likely and a push below the support zone (blue lines) could confirm the bearish push lower. A bullish breakout however could either indicate a deeper wave B (purple) or a new uptrend.

NO COMMENTS

LEAVE A REPLY

Please enter your comment!
Please enter your name here

Exit mobile version