
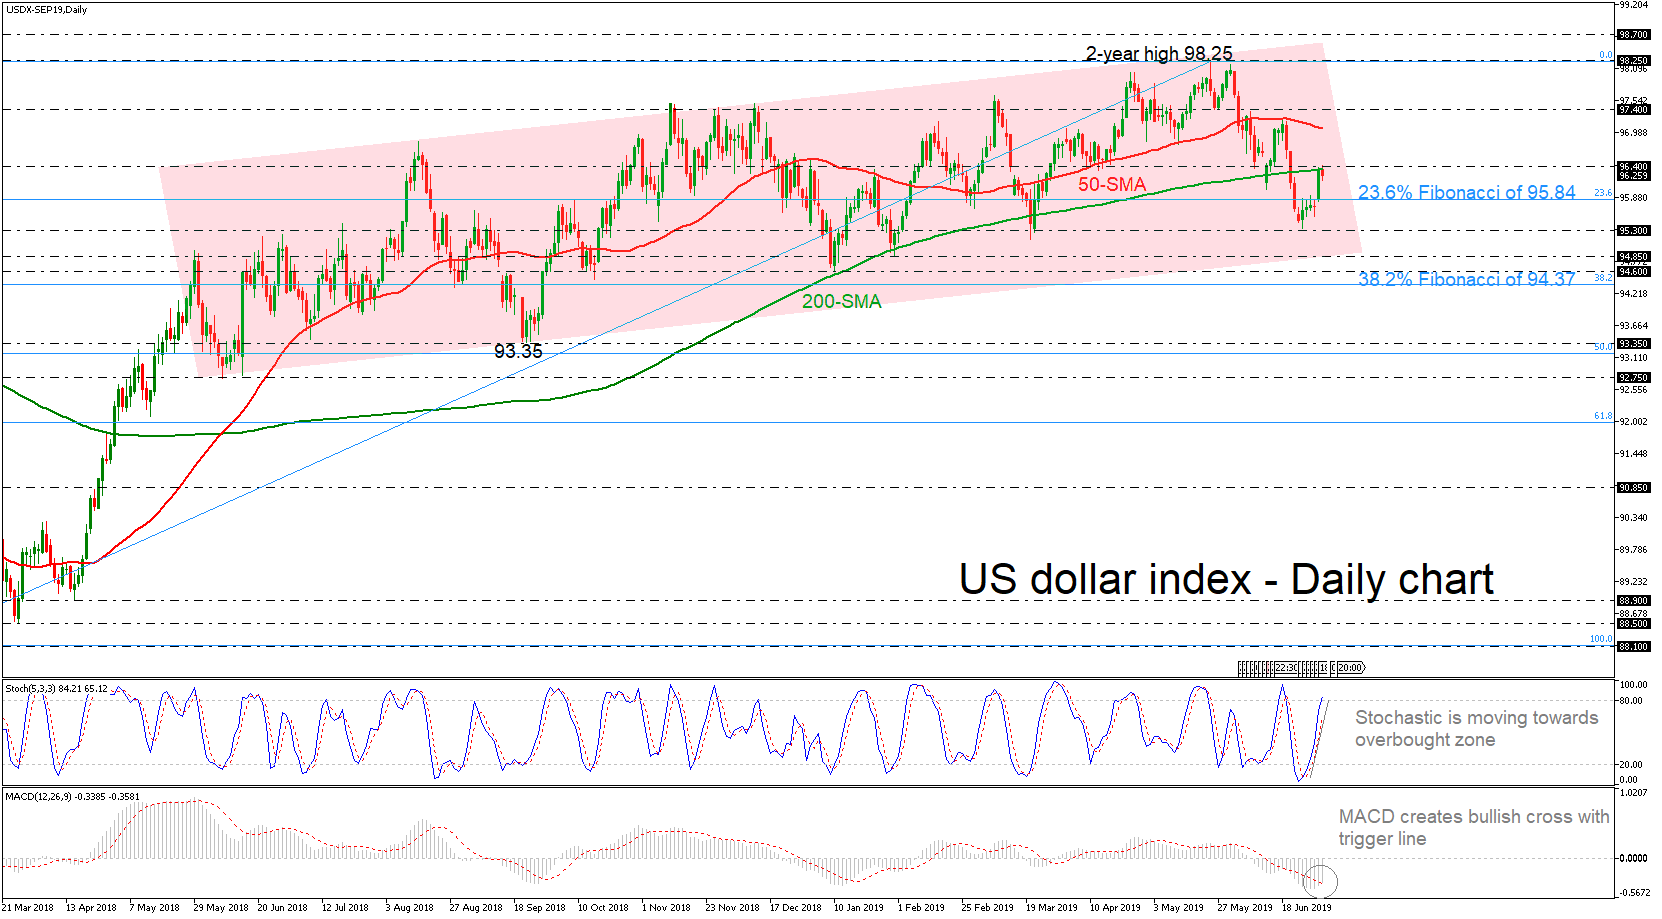
The US dollar index has gained some remarkable ground after the climb above the 23.6% Fibonacci retracement level of the upward movement from 88.10 to 98.25 near 95.84. Currently, the index is failing to surpass the 200-day simple moving average (SMA), which coincides with the 96.40 resistance, flirting with a possible drop.
However, the stochastic oscillator is fluctuating in the overbought mark and the MACD is recording a bullish crossover with its trigger line in the negative zone.
Should the price stretch north and clear the 96.40 resistance, the 50-day SMA could come in focus near 97.00. If the buying interest extends, attention could then turn to the 97.40 resistance barrier, taken from the minor high on June 6. A significant step higher, could drive dollar index until the two-year high of 98.25.
On the flipside, in case of a failed attempt to clear the 200-SMA, prices would test the 23.6% Fibo (95.84) and then the 95.30 support level. If traders continue to sell the index, the price could decline until the 94.85 low, taken from the trough on January 31.
In the long-term, the market retains the bullish structure as it has been trading within an upward sloping channel since June 2016 but in the short-term, traders need to wait for a jump above the 50-SMA for positive orders again.


