
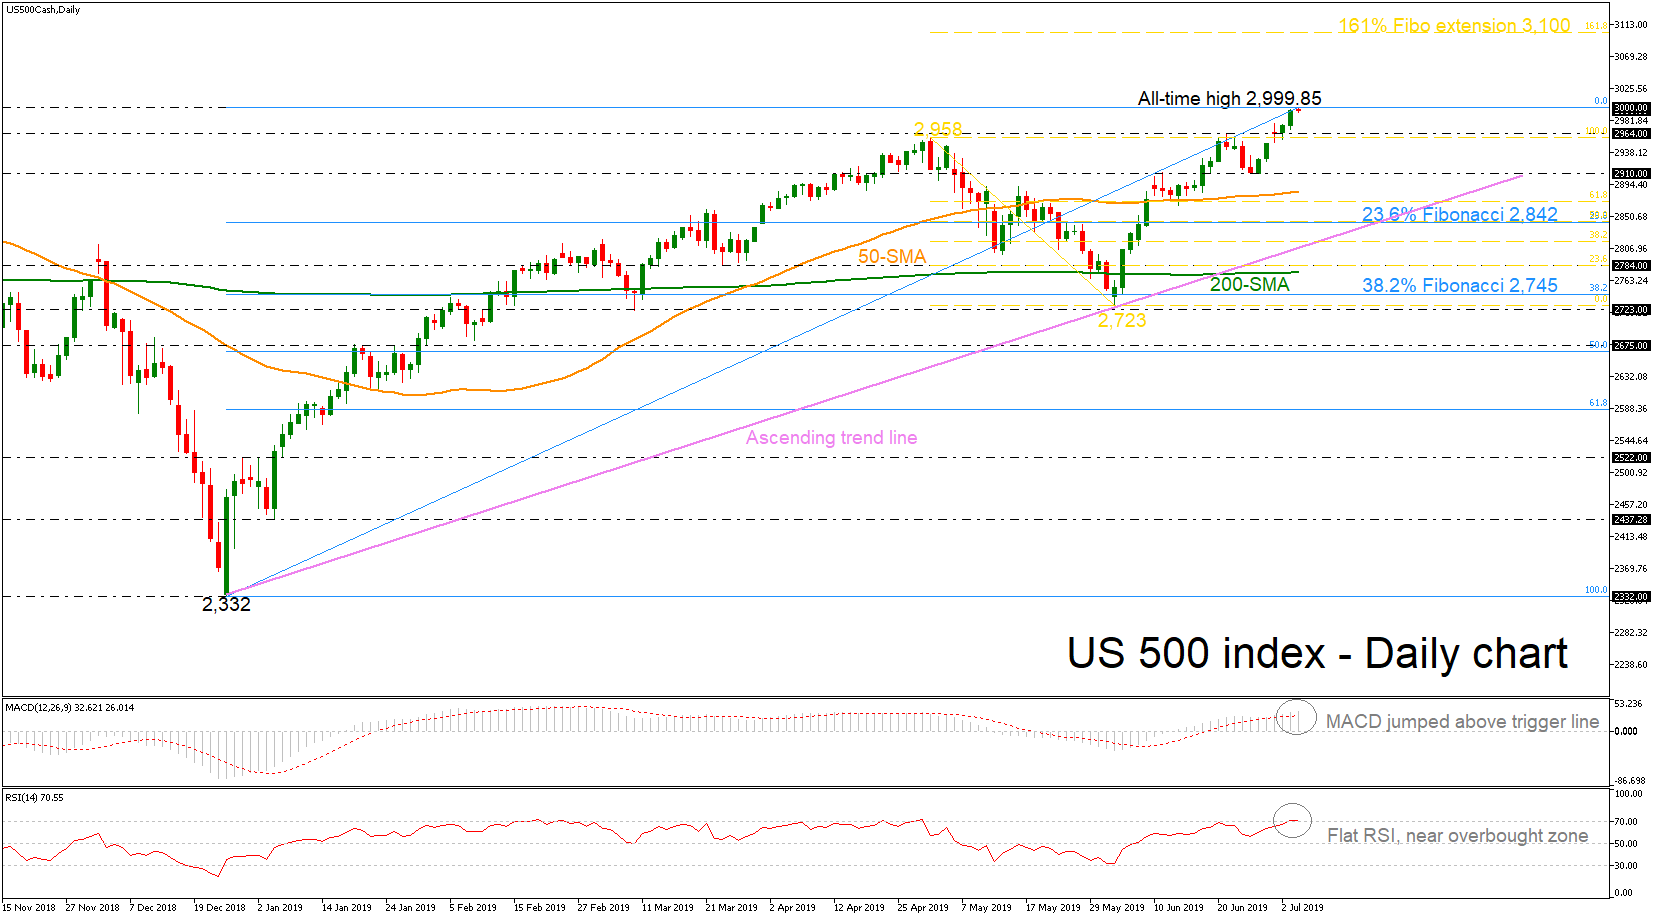
US 500 index showed a notable advance yesterday, completing a fresh all-time high around 3,000, but it ended the day in red.
The advance of the trigger line above the MACD and the bullish momentum in the indicator suggests there is some more room for improvement, while the RSI indicator seems to be flat near the overbought zone, signaling a possible overstretched market. Also, the 50- and 200-day simple moving averages (SMAs) are moving sideways despite the latest upside run.
A closing price above the 3000 psychological mark could send prices towards a new record high near the 161.8% Fibonacci extension level of the downleg from 2958 to 2723 around 3,100.
Should the market correct to the downside, the 2,964 support is coming into focus first before slipping until the 2,910 level. A more interesting battle could start near the 23.6% Fibonacci retracement level of the upleg from 2332 to 2,999.85 around 2,842, which coincides with the long-term ascending trend line.
Overall, in the bigger picture the US 500 index confirmed the upward rally from 2,332 and traders should see for more gains above 3,000. However, any decline below the 23.6% Fibo could feed speculation that a downward pattern may be on the way, with confirmation awaited around the 38.2% Fibonacci of 2,745.


 Favors Upside")


