
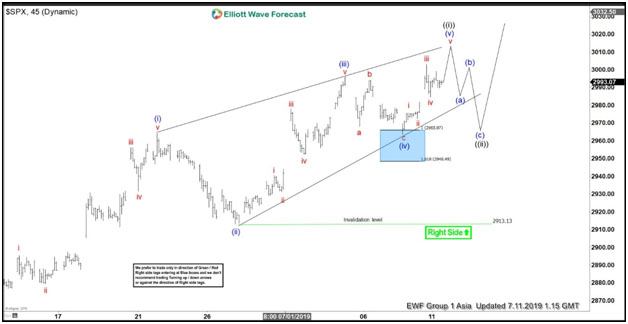
S&P 500 (SPX) shows a bullish sequence from December 26, 2018 low against June 3, 2019 low (2728.81) favoring further upside. Short term Elliott Wave view suggests the rally from June 13, 2019 low (2874.68) is unfolding as a leading diagonal Elliott Wave structure. Leading diagonal is a special type of 5 waves structure with a wedge like pattern and overlapping wave (i) and (iv). Up from June 13 low, wave (i) ended at 2964.15 and wave (ii) ended at 2912.99. Index then resumes higher in wave (iii) towards 2995.84 and wave (iv) pullback ended at 2963.44.
Expect SPX to do 1 more push higher to end wave (v) and this move should also end wave ((i)) in higher degree. Afterwards, Index should pullback within wave ((ii)) to correct the cycle from June 13 low before the rally resumes. Wave ((ii)) pullback should unfold in the sequence of 3, 7, or 11 swing. We don’t like selling the Index and expect Index to continue finding support in pullback. As far as pivot at June 13 low (2874.68) stays intact in first degree, and more importantly pivot at June 3 low (2728.81), Index should resume higher.
SPX 1 Hour Elliott Wave Chart


 Favors Upside")


