
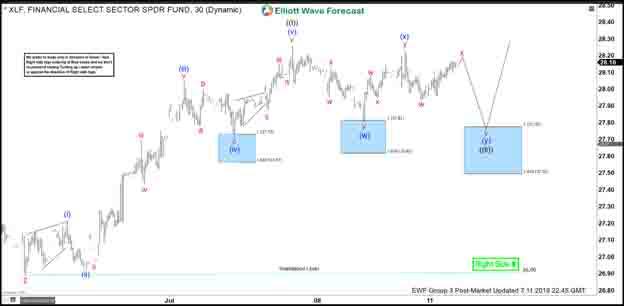
Financial Sector ETF (XLF) shows a bullish sequence from December 26, 2018 low favoring further upside. Short term Elliott Wave view suggests the pullback to 26.9 on June 25, 2019 low ended wave 2. The ETF has rallied higher within wave 3 with the internal subdivided as a 5 waves impulse Elliott Wave structure. Up from 26.9, wave (i) ended at 27.21 and wave (ii) pullback ended at 26.93. The instrument then resumed higher in wave (iii) towards 28.05, wave (iv) pullback ended at 27.71, and wave (v) ended at 28.27. The 5 waves move higher ended wave ((i)) of 3 in higher degree.
Wave ((ii)) pullback is in progress to correct cycle from June 25, 2019 low before the rally resumes. Internal of wave ((ii)) is unfolding as a double three Elliott Wave structure where wave (w) ended at 27.81 and wave (x) ended at 28.23. Expect the ETF to extend 1 more leg lower towards 27.5 – 27.78 to end wave (y) of ((ii)) before a 3 waves bounce at least. We don’t like selling XLF and expect buyers to appear in 3, 7, or 11 swing as far as pivot at 26.9 low stays intact in the first degree.
XLF 1 Hour Elliott Wave Chart

 Interventions?")


