
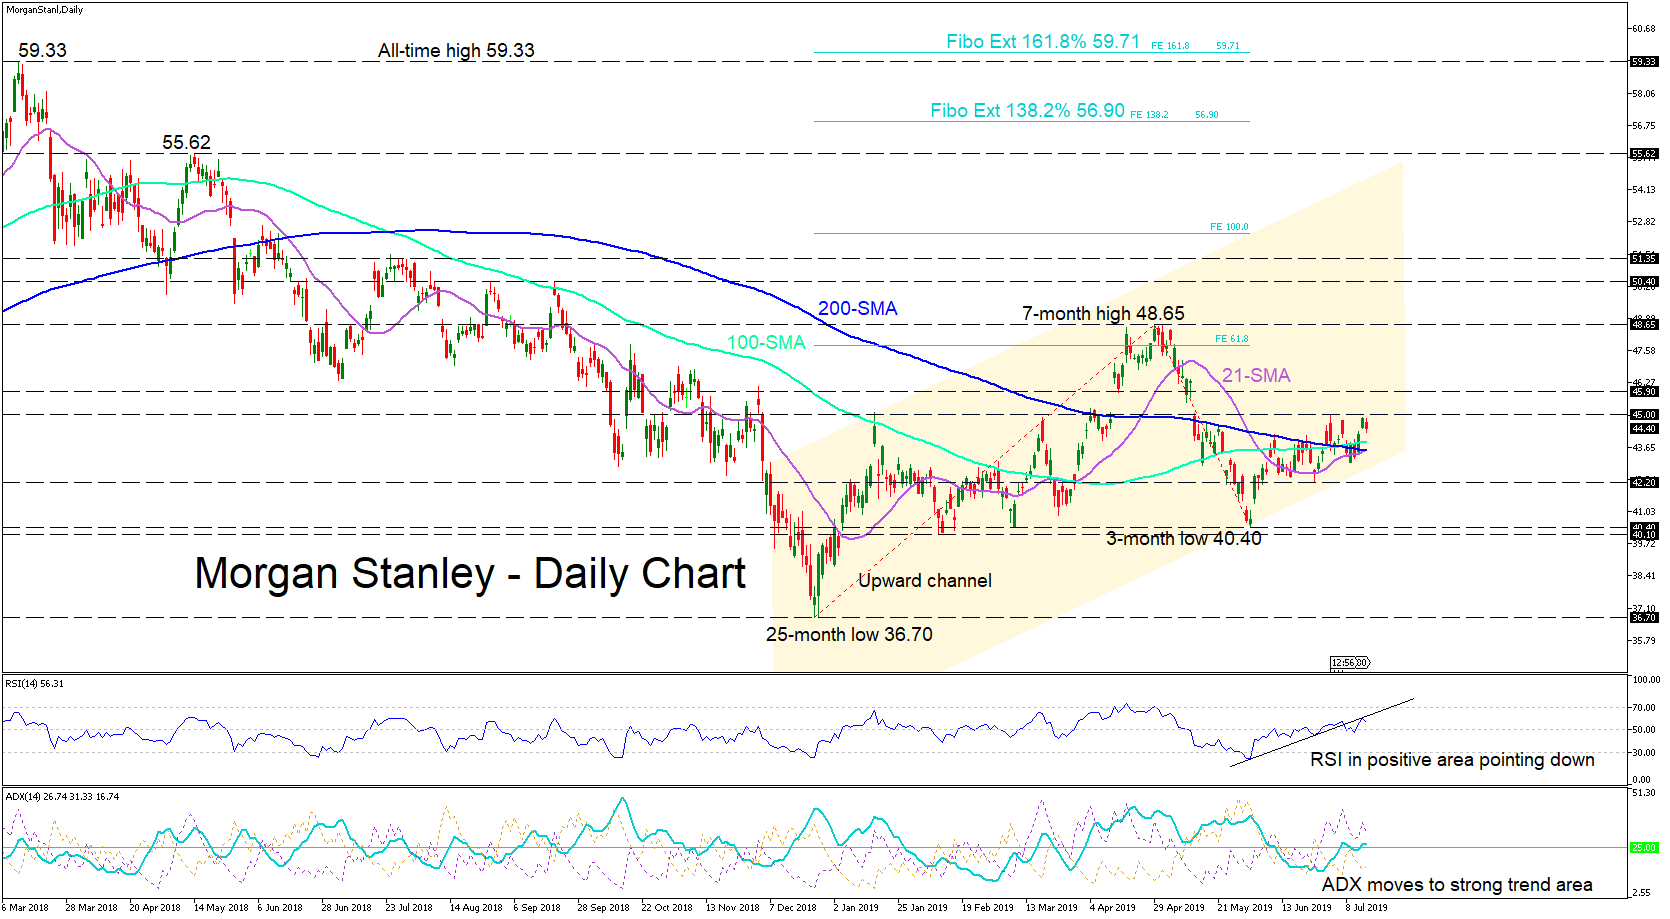
Morgan Stanleys’ stock has been incrementally following the north road since the end of December, and in the last month has risen from a three-month low of 40.40 to face the ultimate battle with the 200-day simple moving average (SMA). Presently, it is facing short-term resistance at the previous weeks’ break high above the 200-day hurdle of 45.00.
Momentum cooled after the 200-day break, as also shown by the RSI as it points down in the positive area, whereas the ADX recently moved to areas of trend kickoff. The short-term 21-SMA has started to cross the 200-SMA upwards, whereas the long-term 100-SMA is already above it and headed further north.
On the way up, a break of the 45.00 immediate resistance and latter 45.90 obstacle, could produce a test of the seven-month high of 48.65. A bullish continuation could then breed levels around 50.40 – 51.35, before any consideration of a further bolt to catalyze the test of the Fibonacci extensions of 138.2% and 161.8%, close to the all-time high of 59.33.
Downwards, a 45.00 resistance hold could prompt an immediate test of the 100- and 200-day SMAs around 43.85 – 43.60. Fracturing the support of 42.20 would be next before a shift to a bearish bias. A breach of the three-month lows next to 40.40 – 40.10 could then be considered.
Overall, the short- and medium-term bullish bias outweighs the risk to the down move.


