
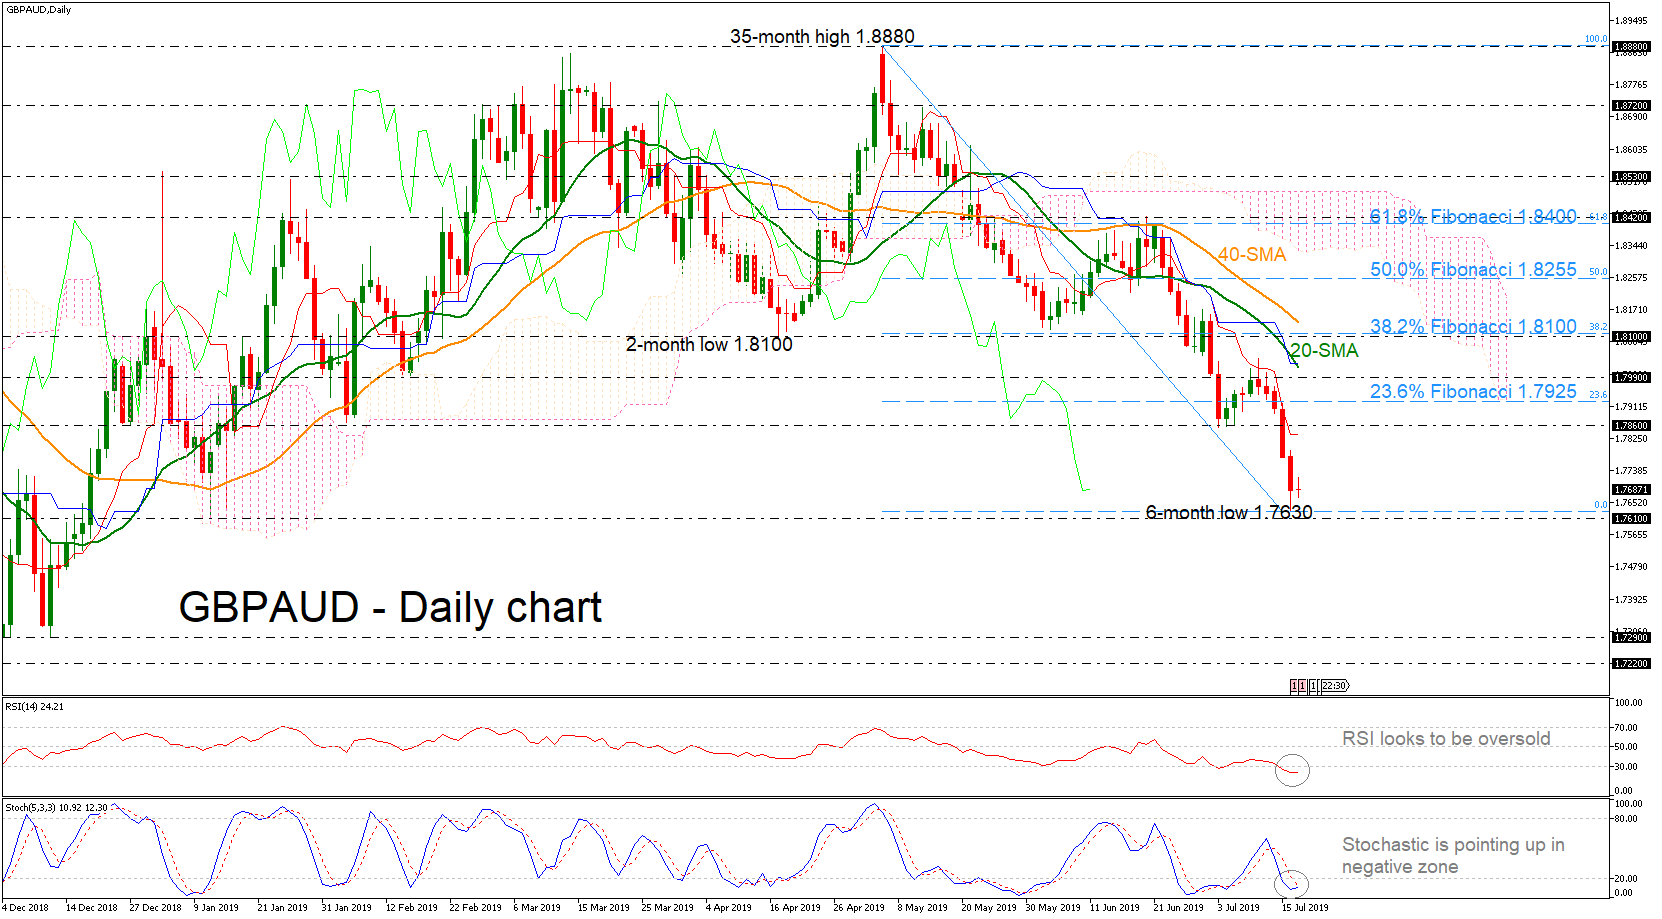
GBPAUD extended its losses towards a new six-month low of 1.7630 on Tuesday, recording five straight red days. The selling interest started after the pullback on the almost three-year high of 1.8880, pushing the pair beneath the short-term moving averages and the Ichimoku cloud. The RSI indicator is hovering in the oversold zone; however, the stochastic oscillator is in process to post a bullish crossover within its lines, indicating weaker bearish movement than before.
Further declines may meet support at the 1.7610 area, taken from the low on January 11, before posting a more aggressive rally until the December 2018 low of 1.7290.
On the upside, resistance could occur around 1.7860 that may be a strong barrier for the bulls to surpass. Higher still, the 23.6% Fibonacci retracement level of the downward wave from 1.8880 to 1.7630 around 1.7925 would increasingly come into scope, while not far above, the 20-day simple moving average is standing near 1.8015.
The short-term picture continues to look predominantly negative, with trading activity continuing the sell-off.


