
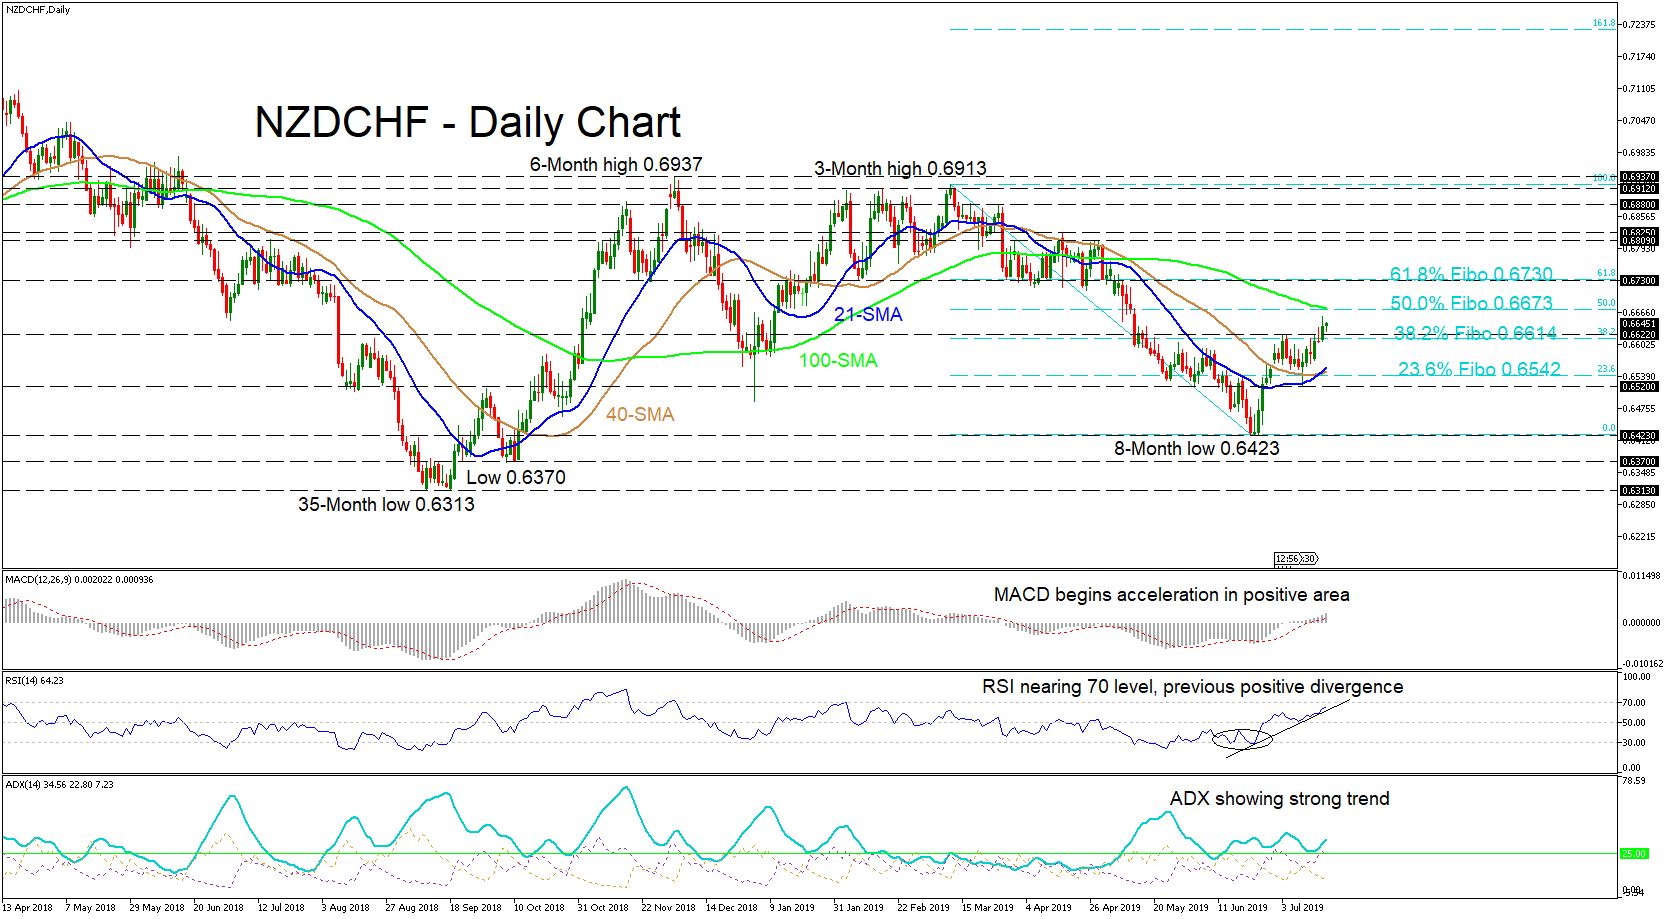
NZDCHF saw some positive divergence in the last several weeks on the RSI which helped it to bounce back from a three-month high tumble from 0.6913 to an eight-month low of 0.6423. Since yesterday the price is trading above the 38.2% Fibonacci retracement level of the down-leg from 0.6913 to 0.6423, of 0.6614 and is heading towards the 50.0% Fibo coupled with the 100-day simple moving average (SMA) at 0.6673.
The short-term SMAs of 21- and 40-days have crossed bullishly suggesting the continuation up. The MACD has started its acceleration in positive areas, while the RSI concurs near the overbought area. The ADX also coincides showing a strong trend.
For the upside, price would need to initially push through the double barrier of the 100-SMA and 50.0% Fibo level near 0.6673. The next test would be the 61.8% Fibo coupled again with a resistance of 0.6730. If this scenario unfolds, the ceiling around 0.6810 – 0.6825 would come into play.
For moves back down, immediate support would be 0.6622, then the 38.2% Fibo of 0.6614, before a lower test of the 21- and 40-SMAs could be tackled around the 23.6% Fibo of 0.6542 and near the support of 0.6520. A definitive shift to the downside would need an eight-month low of 0.6423 to be surpassed before further historical lows unfold.
Briefly, the short-term suggest bullish bias, whereas awareness to a medium-term bearish outlook is necessary.


