
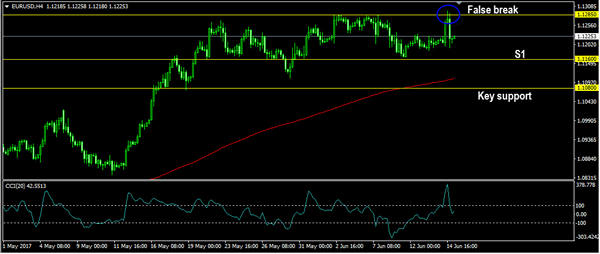
EURUSD
The EURUSD attempted to push higher yesterday, slipped above 1.1285 but whipsawed to the downside and closed lower at 1.1217. As long as stay above 1.1080 I remain bullish, but we may have a false breakout bearish pullback scenario as you can see on my H4 chart below. The bias is bearish in nearest term testing 1.1160. A clear break below that area could trigger further bearish pressure testing 1.1080 key support which remains a good place to buy with a tight stop loss. On the upside, we need a clear break above 1.1285 to continue the bullish scenario testing 1.1350 – 1.1425 region.

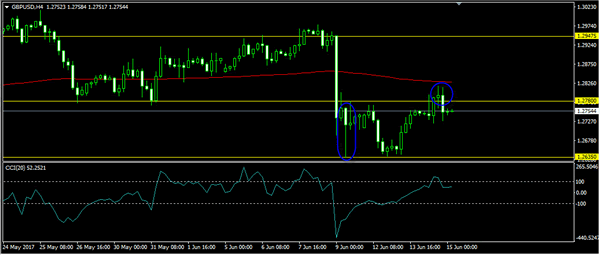
GBPUSD
The GBPUSD was indecisive yesterday. Price slipped above 1.2780 key resistance but closed lower at 1.2750. The bias is neutral in nearest term probably with a little bearish bias testing 1.2700 area. A clear break below that area could trigger further bearish pressure testing 1.2635 key support. The pin bar bullish scenario should remain valid but need a clear break above 1.2780 key resistance to confirm the bullish scenario targeting 1.2900 – 1.3000/50 region. On the downside, a clear break below 1.2635 would nullify any bullish scenario targeting 1.2500 area.

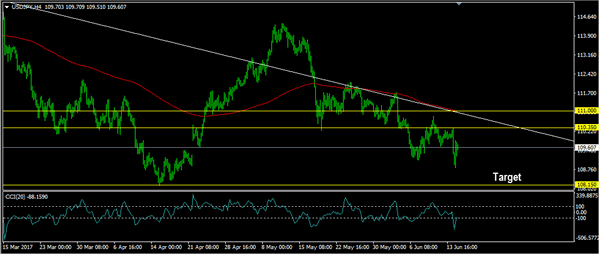
USDJPY
The USDJPY attempted to push lower yesterday bottomed at 108.82 but closed higher at 109.57. The bias is neutral in nearest term probably with a little bullish bias testing 110.35 area but as long as stay below the trend line resistance I remain bearish targeting 108.00 region and any upside pullback should be seen as a good opportunity to sell. Immediate support is seen around 109.25. A clear break below that area could trigger further bearish pressure retesting 108.80 region.
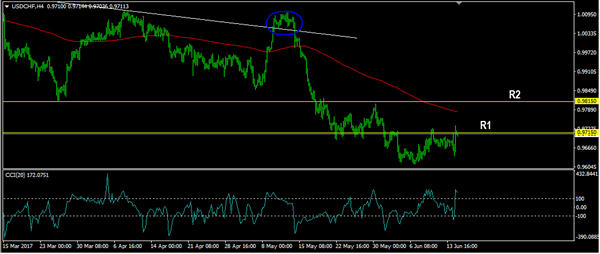
USDCHF
The USDCHF was indecisive yesterday. The bias is neutral in nearest term but as long as stay below 0.9815 I remain bearish and any upside pullback should be seen as a good opportunity to sell. Immediate support is seen around 0.9650 followed by 0.9600. Immediate resistance is seen around 0.9735. A clear break above that area could trigger further bullish pressure testing 0.9815 which is a good place to sell with a tight stop loss.


