
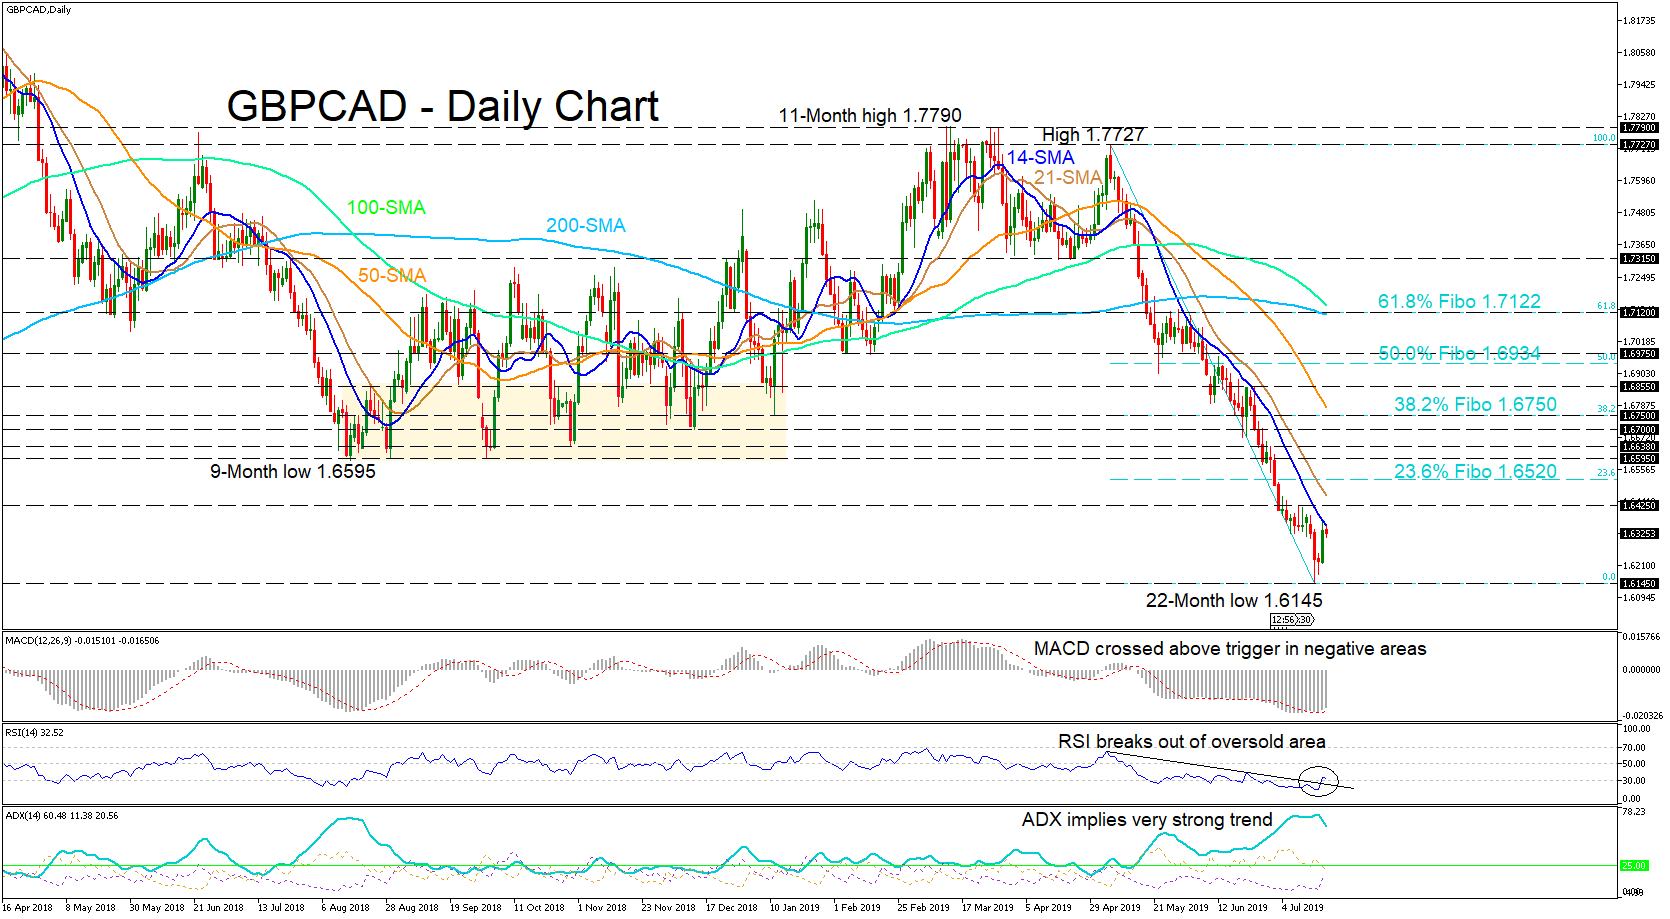
GBPCAD slipped aggressively from the May 6 top of 1.7727, breaking through the congested support lines formed during the August 2018-March 2019 up leg, with buyers only seeming to make progress in stalling this down push yesterday.
The short-term simple moving averages (SMAs) of 14- and 21-days still agree with the south move, and furthermore, the 14-day SMA paused the buyer’s effort to start a pullback. The long-term SMAs of 50-, 100- and 200-days also concur, with a bearish cross of the 50-SMA below the 200-SMA. The MACD and the RSI continue to show negative momentum as they remain in negative areas. The ADX implies that the down trend is very strong.
A continued collapse in the pair would require the 14-day SMA and initial resistance of 1.6425 to hold, and possibly the 100-SMA to cross below the 200-SMA, which would send the price to test a twenty-two-month low of 1.6145.
A shift to the upside would require the pair to break the initial barriers of the 14-SMA and the resistance of 1.6425, before tackling the 21-SMA and then the 23.6% Fibo of the down leg from 1.7727 to 1.6145, of 1.6520. Jumping the hurdles of congested resistances coupled with the 38.2% Fibo of 1.6750 and the 50-SMA around there would make further northward displacement seem easier.
Summarizing, the bearish bias is prevalent across all time frames for now.


