
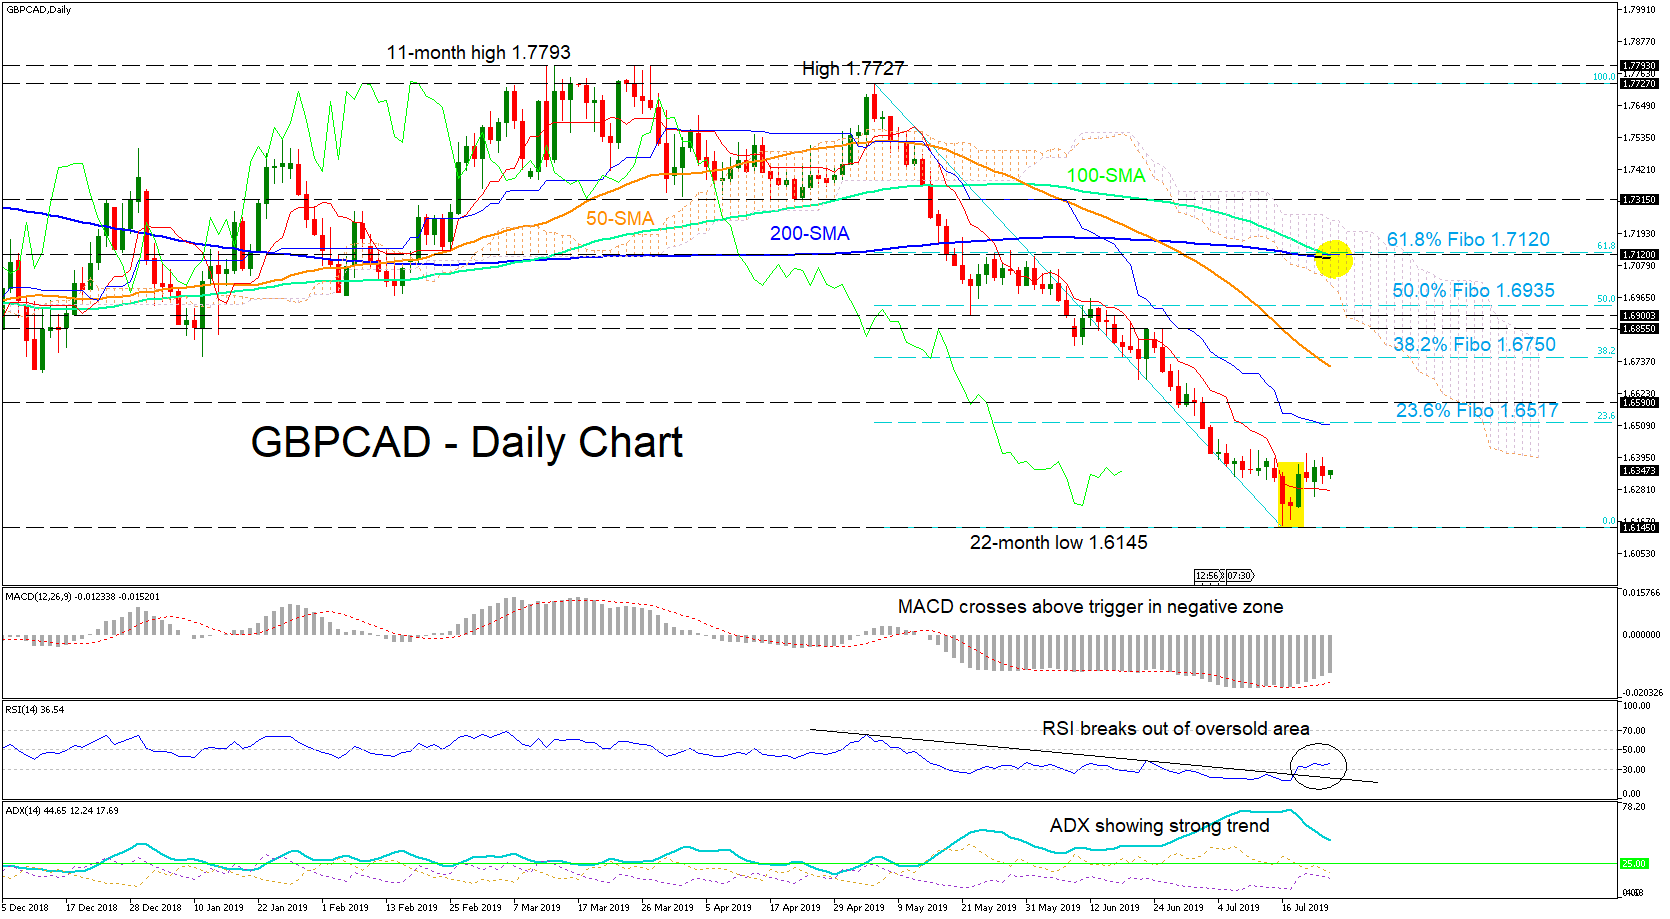
GBPCAD’s prevailing downtrend came to a halt on July 16, as price printed a morning star pattern. Potential reversal also is implied from the candles after the pattern, indicating uncertainty to the direction. Concurring we can see that the Tenkan-sen average has moved horizontally.
As momentum evaporates the MACD moves above the red trigger line in the negative zone, with the RSI above 30 level becoming slightly flat. The ADX still indicates a strong trend. The 50-, 100- and 200-day simple moving averages (SMAs) still confirm bearish bias.
A short-term pullback confirmed by more bullish candles could see the 23.6% Fibonacci retracement of the down move from 1.7727 to 1.6145, of 1.6517 be tested, before near resistance of 1.6590. If a keep on upwards unravels, a visit to the 50-SMA, around 1.6725 would play out before the 38.2% Fibo of 1.6750. A more definitive push north would need to fracture the resistances and Fibonacci levels, before the 61.8% Fibo of 1.7120 can be violated for a bullish bias shift.
The enduring negative scenario would see the 100-SMA cross the 200-SMA downwards and have price penetrate the recently formed 22-month low of 1.6145. If the bearish bias dominates again, the seven-and-a-half-month low of 1.5830 would be the next target.
Overpowering bearish bias seems to be here to stay, but traders need to be aware of a short-term pullback, and only a break above the 1.7120 resistance will turn the bias positive.


