
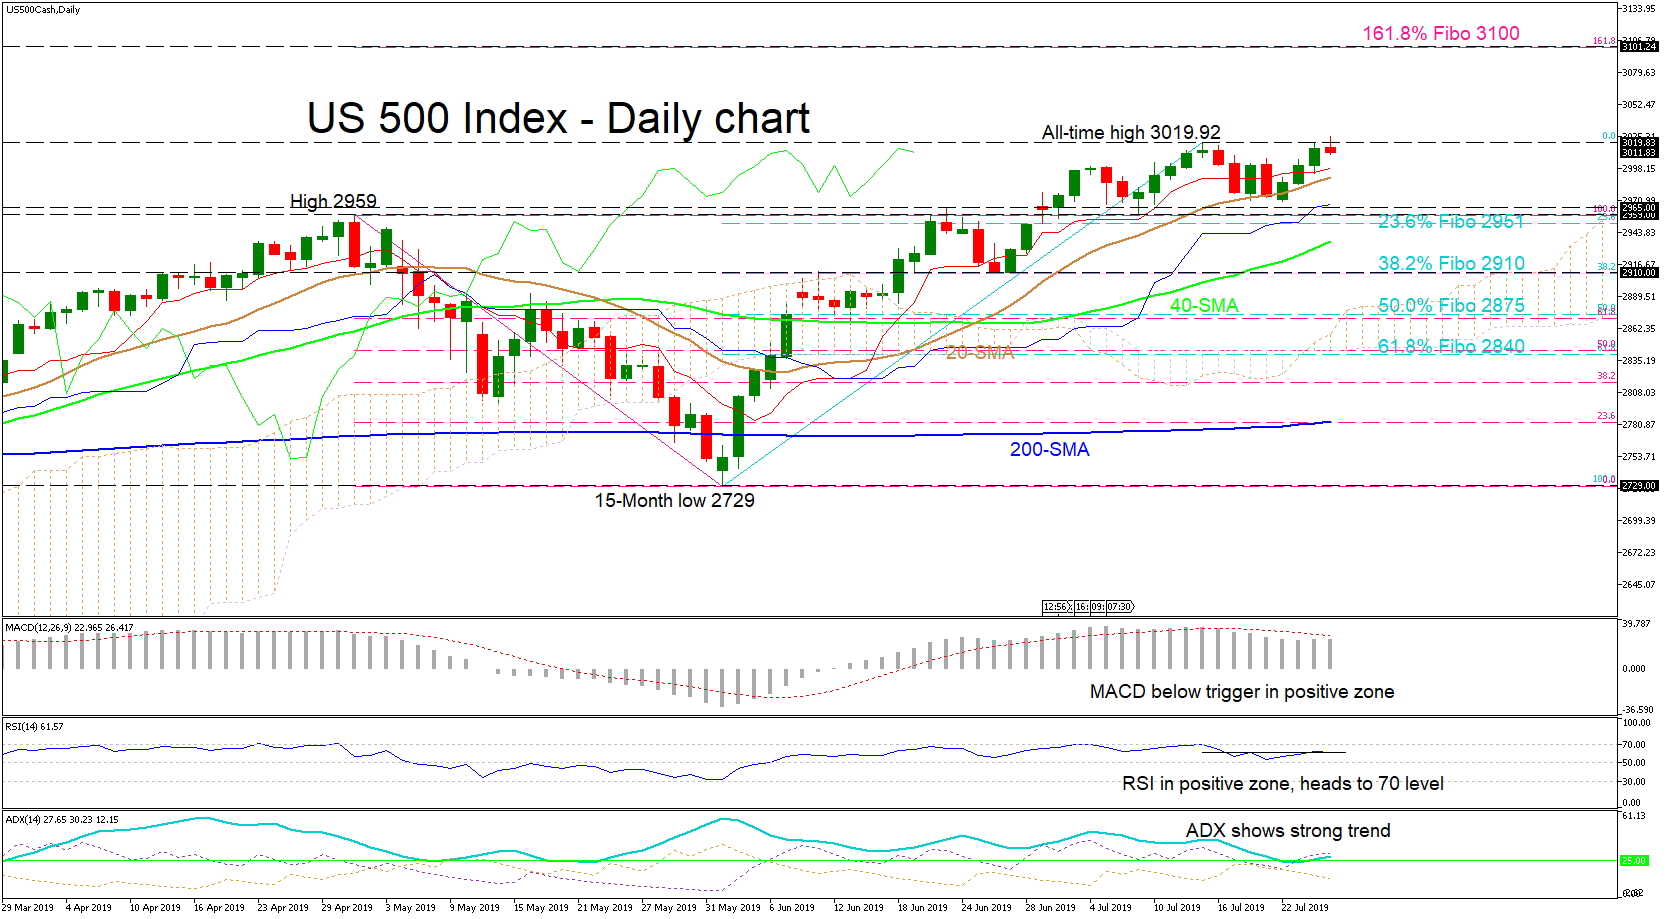
US 500 stock index after retreating last week, began a sure but steady move to revisit the all-time high of 3019, and currently is climbing above it. The price found support at the Tenkan-sen average, and the moving averages are headed higher holding the price above them.
The momentum indicators suggest a quick reload necessary for the jump ahead, as the MACD is nearing a cross above the trigger in the positive region, whilst the RSI is slightly pointing up approaching the 70 level. The ADX is also indicating a strong trend scenario.
Downwards, the area around the all-time high would need to hold, initially sending price down to face the 20-day simple moving average (SMA) currently at 2990, before the support region of 2959 – 2965 can be tested. Breaching the levels would bring the 23.6% Fibo of the up move from 2729 to 3019.92, of 2951 up for grabs. Following would be the 40-SMA presently at 2936 before consideration of the 38.2% Fibo of 2910 coupled with swing support.
For upside continuation, a strong close candle above the all-time-high would cement the short-term bullish bias and could unfold the 161.8% Fibo of the down move from 2959 to 2729, of the 3100 handle.
Summarizing, a bullish bias dominates all the time frames, but a very short-term neutral bias could unfold between the all-time-high of 3019 and 2959 if the resistance of 3019 holds.


