
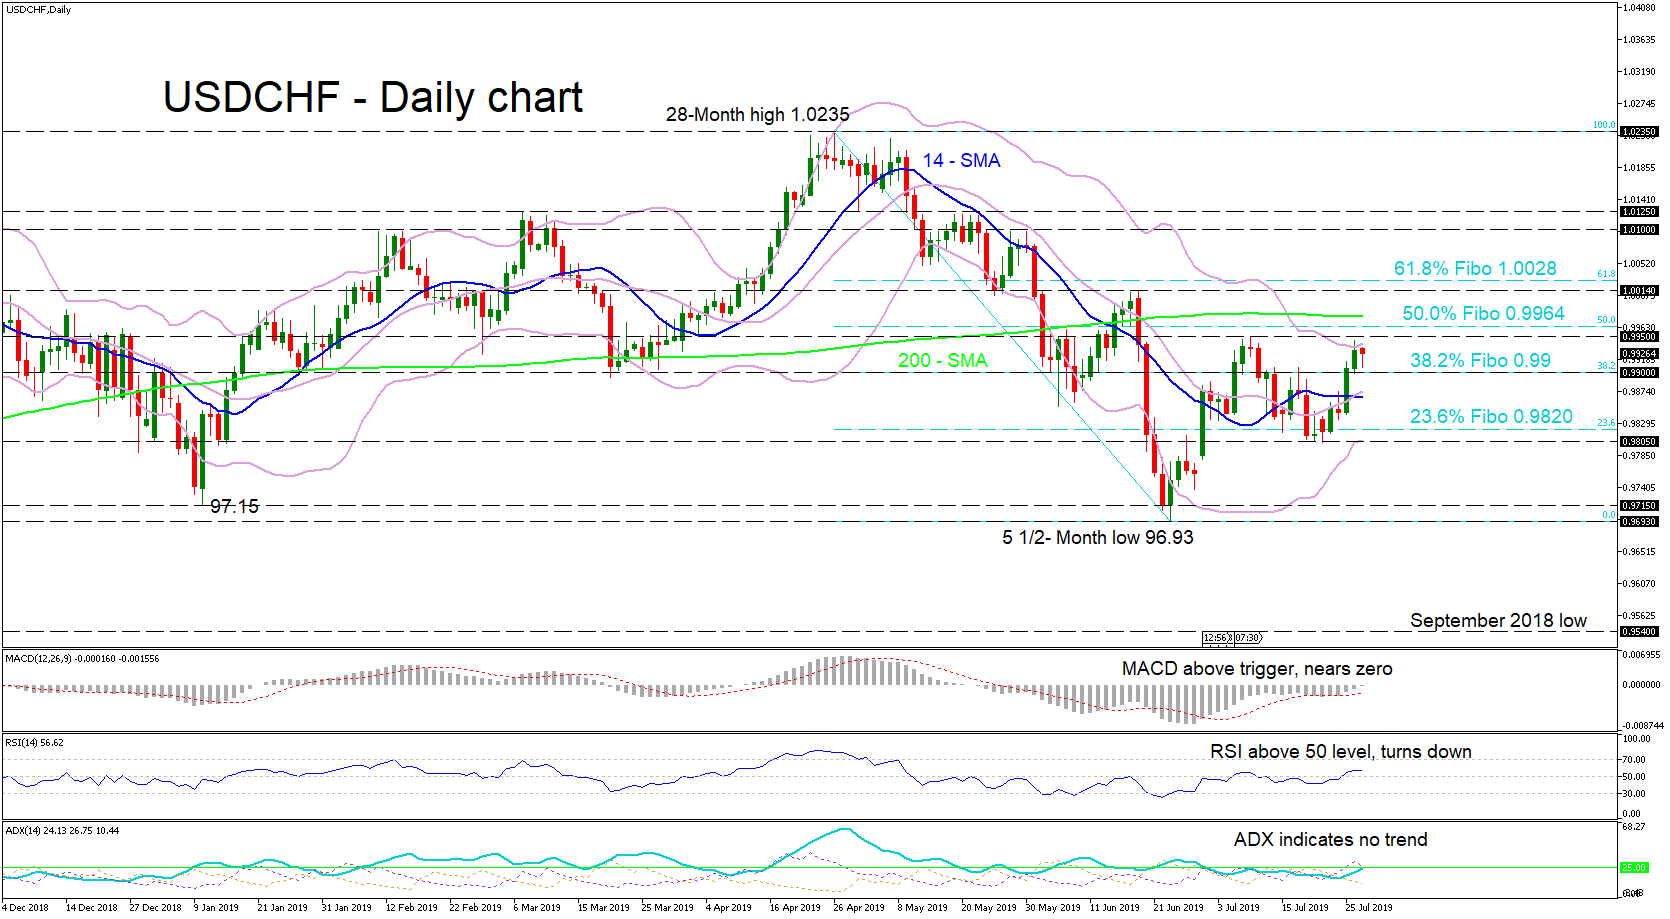
USDCHF dropped from a twenty-eight-month high of 1.0235 to a five-and-a-half-month low of 96.93 over a three-month period. Buyers failed to push above the previous swing peak of 0.9950, and the price is currently hovering near the upper Bollinger band.
The 14-day and 20-day simple moving averages (SMAs) show no clear direction, whereas the MACD and RSI are giving mixed signals. On the one hand MACD is trying to exit the negative zone, but the RSI has turned down. The ADX indicates no trend is in place. Also, the bands have squeezed closer together suggesting a shift to low volatility.
In a downward scenario, if resistance at 0.9950 holds and price breaches the 0.99 zone, which is the 38.2% Fibo of the down leg from 1.0235 to 96.93, the next support initially would come from the middle band and the 14-SMA. A stronger push past the 23.6% Fibo of 0.9820 that violates the swing low of 0.9805 could turn the short-term bias bearish again.
Further north above the upper band and the resistance area of 0.9950, the price may test the 50.0% Fibo of 0.9964 and the 200-SMA which is near, before having to tackle the resistance of 1.0014, which could shift the bias to bullish.
Overall, the outlook seems to be neutral for now trading between 0.9805 and 0.9950. A break in either direction is needed to unveil the short-term bias.


