
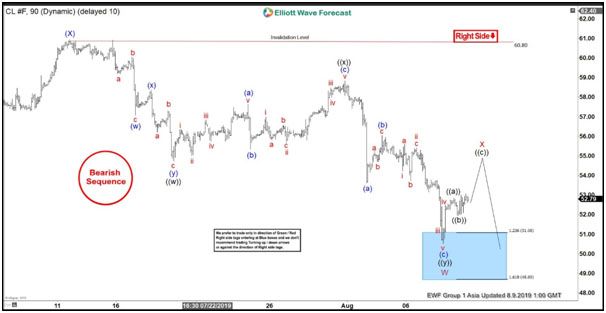
Oil shows incomplete bearish sequence from April 23, 2019 high favoring further downside. The recent break below June 5, 2019 low (50.60) confirms the double three Elliott Wave structure from April 23 high and suggests the next leg lower has started. Near term, bounce to 60.8 ended wave (X). Wave (Y) is in progress and the internal is unfolding also as a double three in lesser degree. Down from 60.8, wave ((w)) ended at 54.72, wave ((x)) ended at 58.82, and wave ((y)) ended at 50.52. The decline to 50.52 ended wave W of (Y).
Wave X bounce is currently in progress to correct cycle from July 11, 2019 high in 3, 7, or 11 swing before the decline resumes. The internal of the rally is proposed to be unfolding as a zigzag Elliott Wave structure. Up from 50.52, wave ((a)) ended at 52.84 and wave ((b)) ended at 51.94. While short term dips stay above 50.52, expect Oil to extend higher in wave ((c)) of X. Afterwards, Oil should resume the decline lower. Potential target to the downside is 100% extension from April 23 high towards 41.2 – 45.
We don’t like buying the proposed bounce and expect sellers to appear once rally is complete in 3, 7, or 11 swing. As far as pivot at 60.8 high stays intact, Oil should resume lower again.
Oil 1 Hour Elliott Wave Chart


