
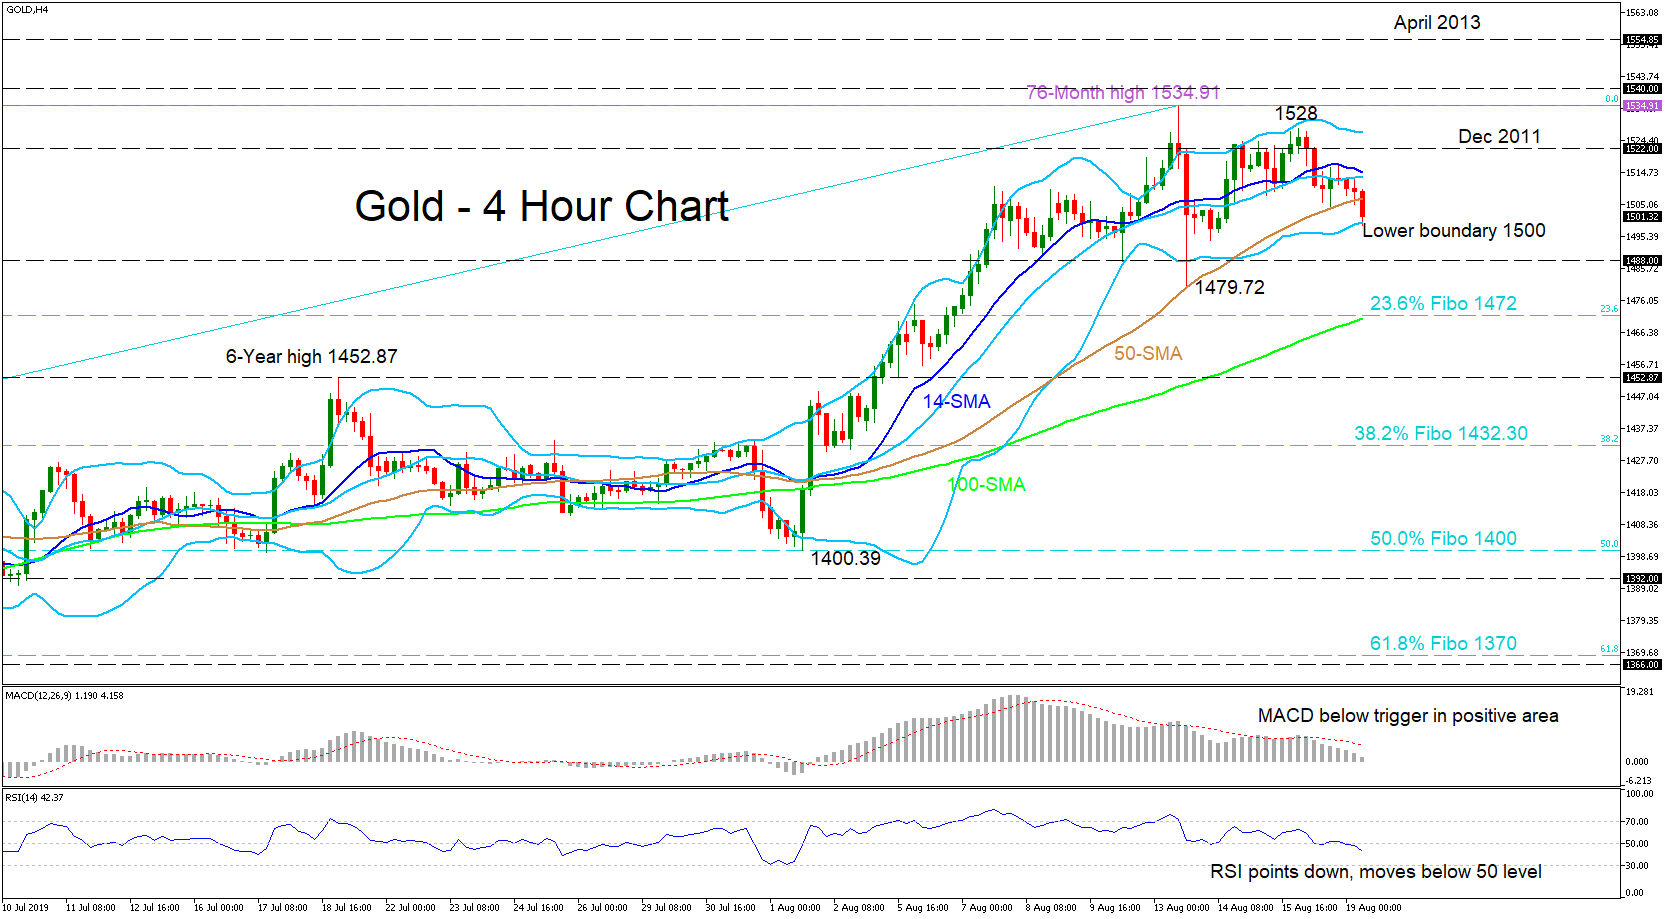
Gold has only been focused on making new peaks as it logged a new 6-year and four-month high of 1534.91. The metal corrected to the downside after the high on August 13 but the 50-period simple moving average (SMA) in the four-hour chart managed to limit the negative movement.
The MACD and the RSI are indicating that the positive directional momentum is decreasing as the MACD is underneath its red trigger line, nearing zero, whereas the RSI has moved slightly below the 50-level and into the bearish area. In spite of this the upward-slope in the 50- and 100-period SMAs signals that the bullish trend in the bigger picture is likely to stay in place for now.
If price picks up above the 50-period SMA, initial resistance could come at 1522 taken from the December 2011 low. Moving north, a significant breach of the recent high of 1534.91 could see a retest of the April’s 1555 resistance area.
In a continued decline, support of 1488 could be retested before the focus shifts to the swing low of 1479.72. Slightly lower, the 23.6% Fibonacci retracement level of the up-leg from 1266.20 to 1534.91 could also cape downside corrections, a break of which may bring the 1452.87 previous swing high on the radar. If the latter fails, the next target could be the 38.2% Fibo of 1432.30.
In the medium-term picture, the outlook remains bullish and only a shift below the 50.0% Fibo of 1400 would turn the sentiment back to neutral.


")


