
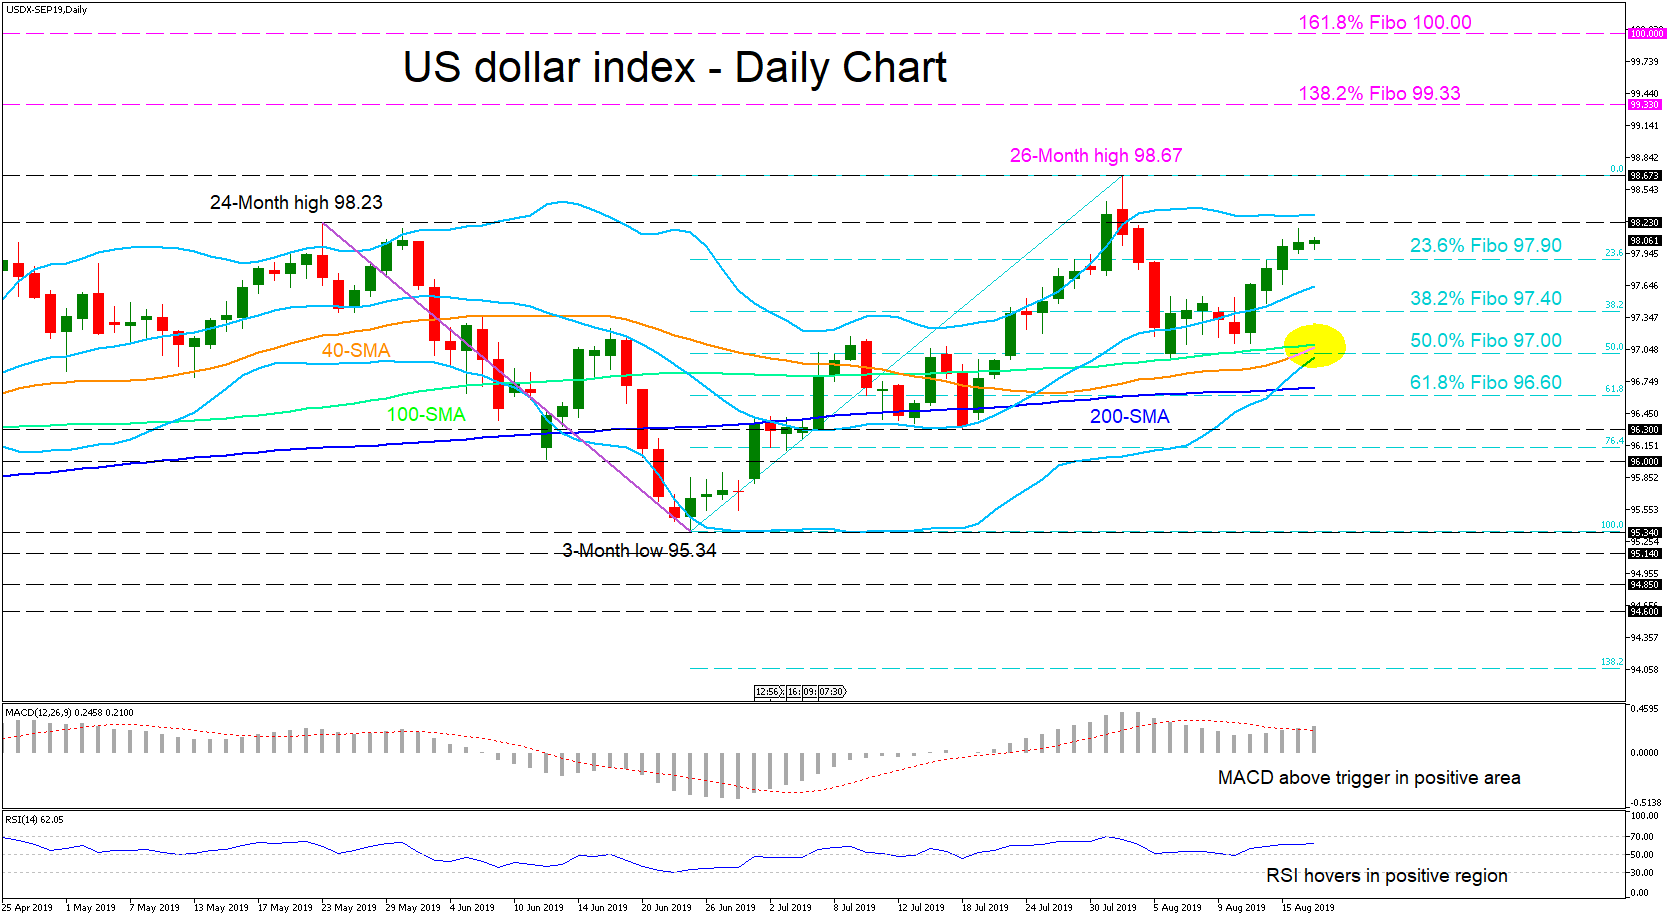
The US dollar index moved north from the 100-day simple moving average (SMA) as buyers dominated, taking back most of the losses produced from the high of 98.67 on August 1. The price has come to settle above 97.90, which is the 23.6% Fibonacci retracement level of the up-leg from 95.34 to 98.67, and slightly below the May peak of 98.23.
The momentum indicators are reflecting a bullish bias as the MACD is ascending again above its red trigger line in the positive region and the RSI is starting to incline. It’s worth mentioning that the 40-day SMA could create a bullish cross of the 100-day SMA which would further back up the move higher.
If the price manages to breach the May 23 high of 98.23, a retest of the recent twenty-six-month high of 98.67 could play out. Violating that top, the bulls could push the price to the 138.2% Fibonacci extension level of the down wave from 98.23 to 95.34, before the 100.00 resistance can be considered which also happens to be the 161.8% Fibo hurdle.
In the negative scenario, a drop past the 23.6% Fibo of 97.90 could send support to the 38.2% Fibo of 97.40, while lower the 97.00 level, could attract extra attention as the 100-day SMA and 50.0% Fibo also lie in the area. Slipping below the 200-day SMA and more importantly under the swing low of 96.30 the outlook would turn neutral.
Summarizing, the long- and short-term bullish bias still prevails.


