
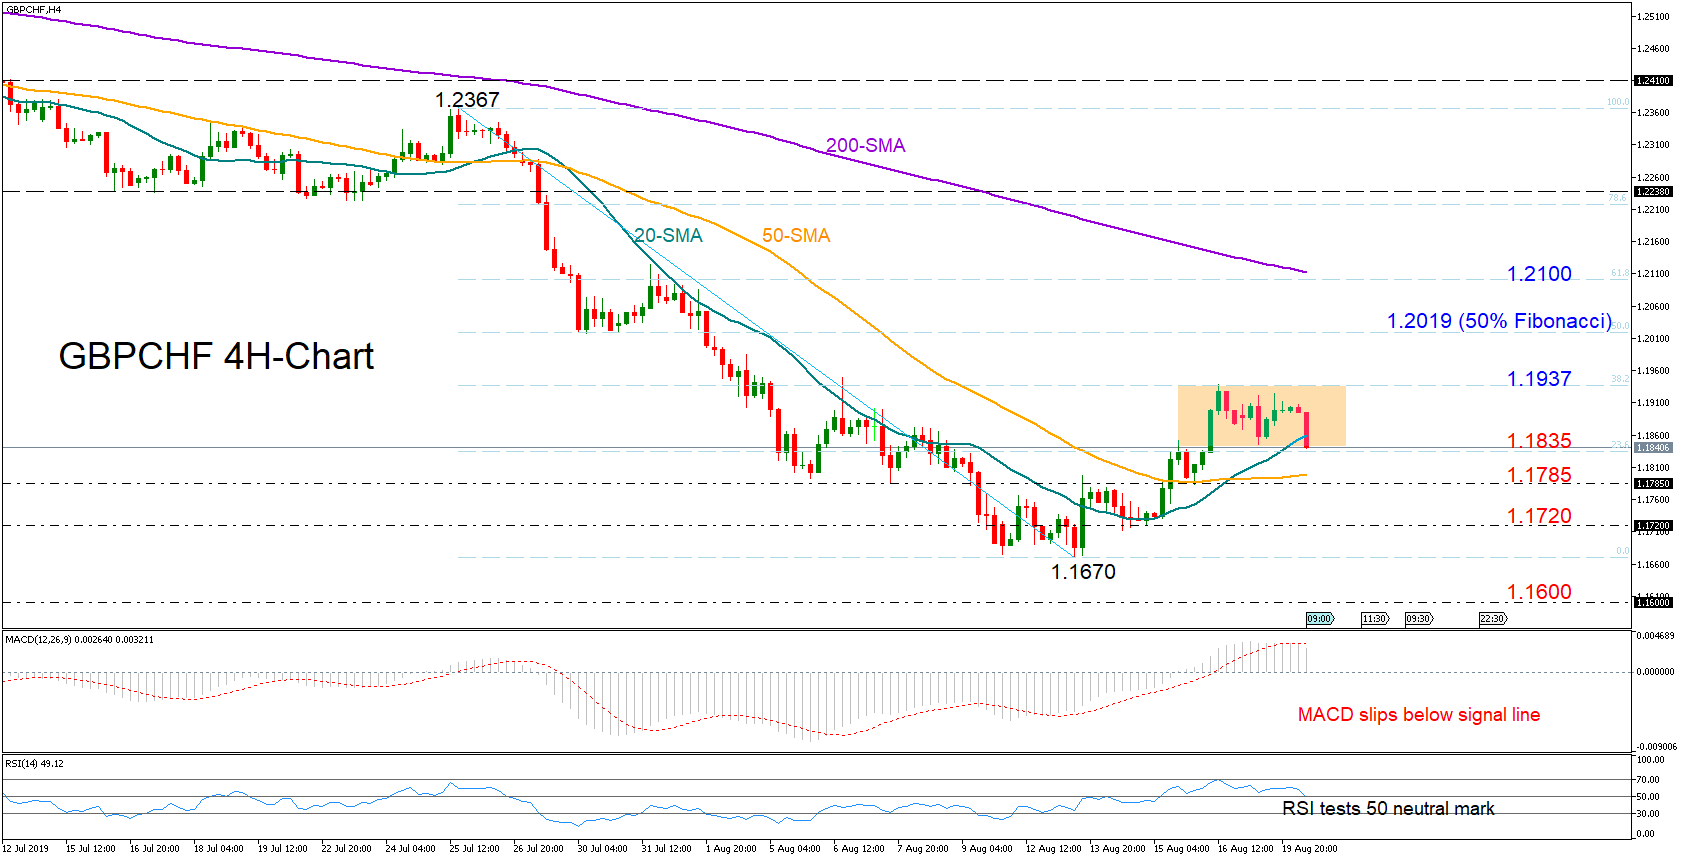
GBPCHF has been hovering between the 23.6% and the 38.2% Fibonacci levels of the bearish move with a top at 1.2367 and a low at 1.1670 over the past two sessions.
Technically, the sentiment may hold neutral-to-bearish in the short-term in the four-hour chart as the RSI is currently positioned around its 50 neutral mark and the MACD is deviating below its red signal line.
Nevertheless, if the sellers manage to finish the session below the 23.6% Fibonacci of 1.1835 and comfortably under the 20-period simple moving average (SMA), the sell-off could extend towards the 1.1785 barrier where the 50-period SMA is currently flattening. Lower, the market may stall within the 1.1714-1.1670 area, which if violated would open the way towards the 1.1600 and 1.1500 psychological levels.
Otherwise, the 50% Fibonacci of 1.2019 could flash on the radar in case the market closes above the 38.2% Fibonacci of 1.1937. Further up, a bigger challenge could emerge near 1.2100 as both the 200-period SMA and the 61.8% Fibonacci happen to be in that neighborhood. Beyond the latter, the market may attract even stronger buying interest.
Summarizing, GBPCHF is expected to follow a neutral-to-bearish course in the short-term.


