
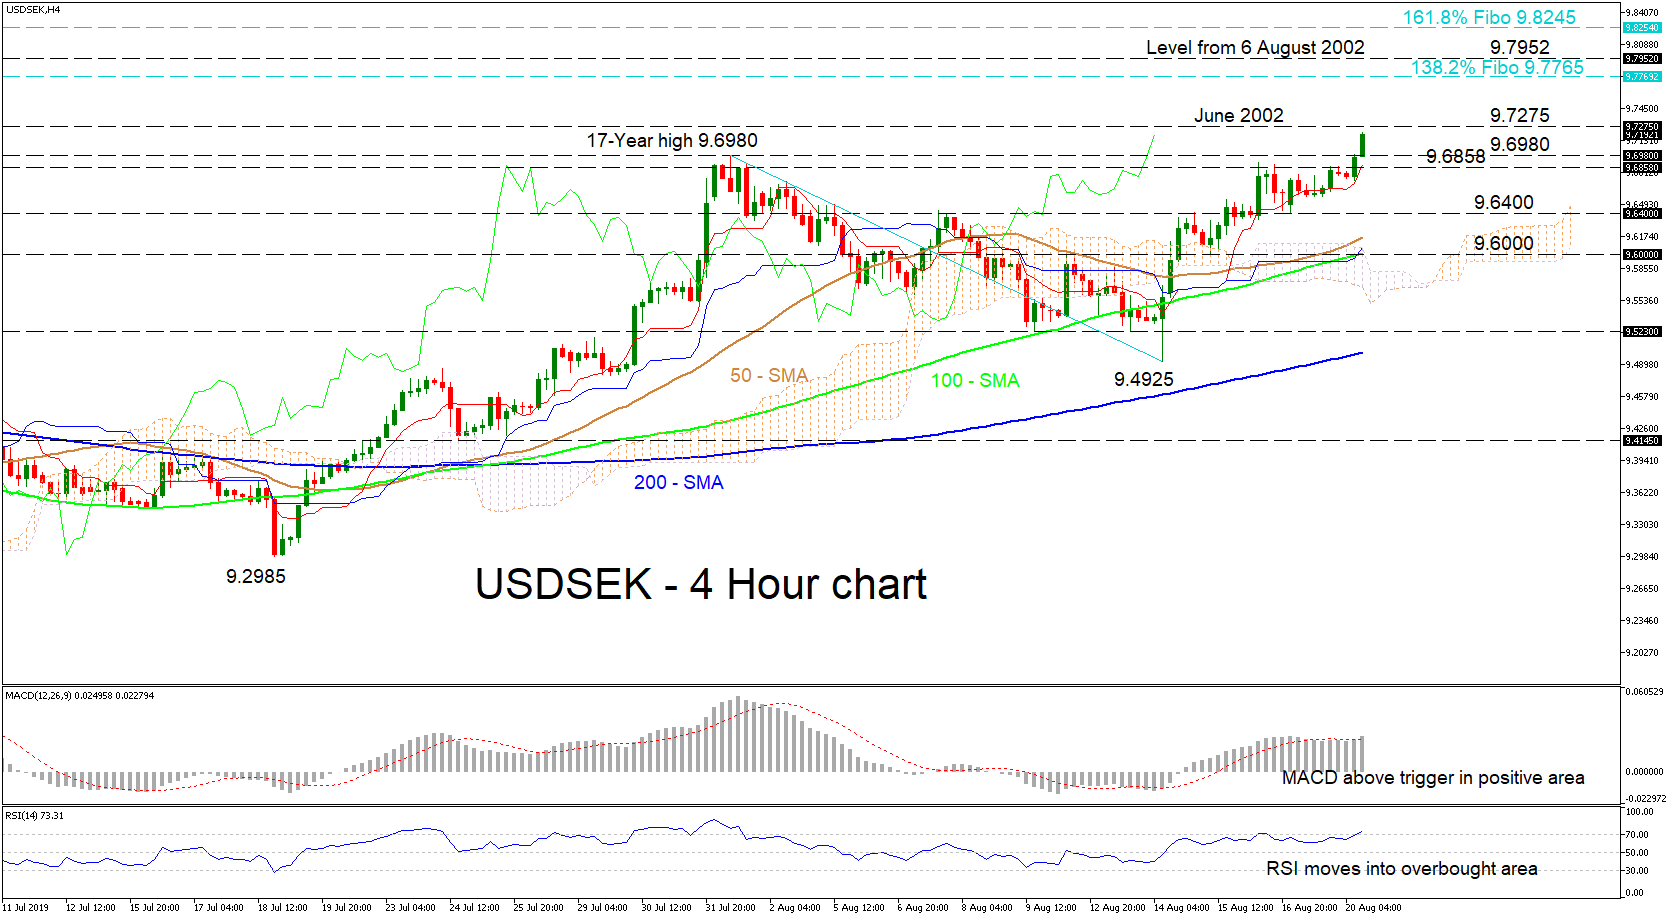
USDSEK’s revived rally upwards from the 9.4925 low of August 14, saw the bulls take the reins to push the pair higher above a 17-year high of 9.6980. The Tenkan-sen average has steepened confirming the new move, whilst bullish signals also come from the 50-, 100- and 200-period simple moving averages (SMAs) as they rise on the four-hour chart.
The MACD and the RSI concur with the apparent strength in positive directional momentum, as the MACD has moved above its red trigger line in positive areas, and the RSI is inclining into the overbought region.
If the bulls manage to keep the run up, the price may find resistance at 9.7275 which is the June 2002 swing high. Surpassing this level could draw attention to 9.7765, which is the 138.2% Fibonacci extension level of the down wave from 9.6980 to 9.4925. If the buying continues, then the August 2002 level of 9.7952 could be seen.
If sellers start to dominate, the positive picture could see a correction below the 9.6980 and 9.6858 levels, before a shove lower which could find some support from the 9.6400 swing low. More losses could have sellers drop the price into the Ichimoku cloud, down to the 9.6000 obstacle where the 100-period SMA also lies.
Overall, the short-term positive picture has gained confidence looking for moves higher, but if a close below 9.4925 occurs, the bias could turn back to neutral.


