
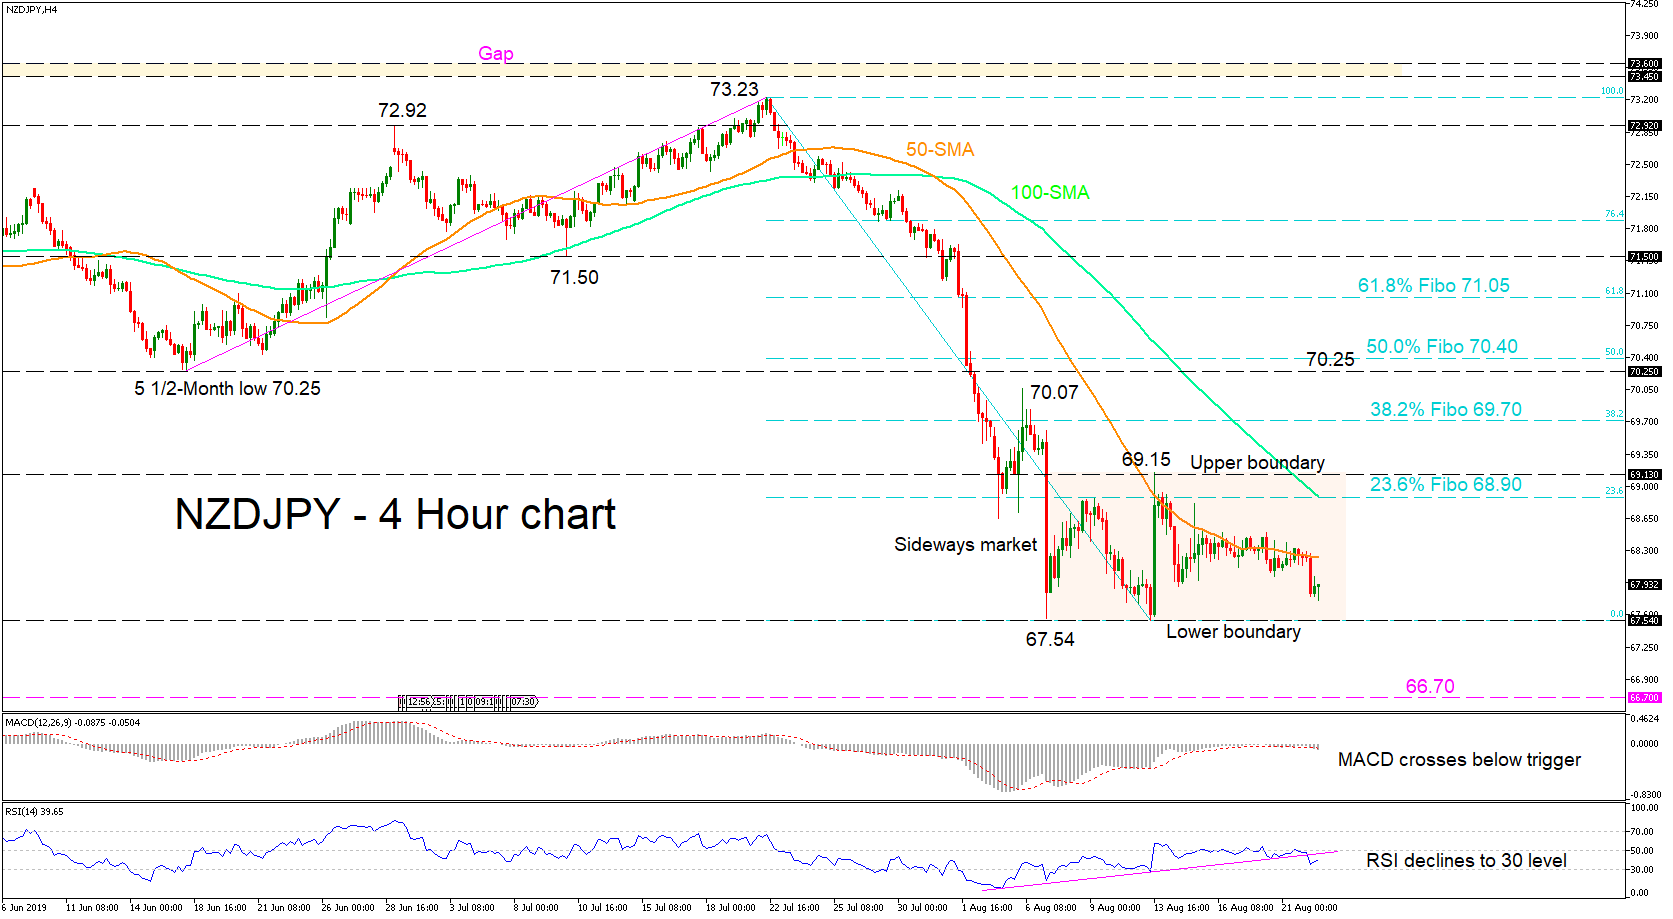
NZDJPY came shy of filling the gap of 73.45 – 73.60 and then dropped to a low of 67.54, before moving into a short-term trading range on the four-hour chart. The bulls have found the 50-period simple moving average (SMA) to be a worthy adversary, denying them a move above.
The momentum indicators although in negative regions, reflect an absence of directional momentum. The MACD is below its red trigger line and only slightly underneath the zero mark, while the RSI has turned down headed for the 30 level.
In the negative scenario, if the 50-period SMA holds and the bears pick up, the price could move to test the 67.54 lower boundary of the sideways market. Piercing down could have support come from the low of 66.70, which is a level not seen since November of 2012. If the selling interest persists, the 65.42 level could unfold – this being the 261.8% Fibo extension of the up wave from 70.25 to 73.23.
Looking north, the upper boundary at 69.15 is the target once the bulls manage to breach the resistance from the 50-period SMA. The up move could encounter some downside pressure before the upper boundary from the 68.90 level, which is the 23.6% Fibonacci retracement level of the down leg from 73.23 to 67.54, and where the 100-period SMA also lies.
Overall the short-term sentiment is neutral-to-bearish, but a break above 73.23 could shift it to neutral.


