
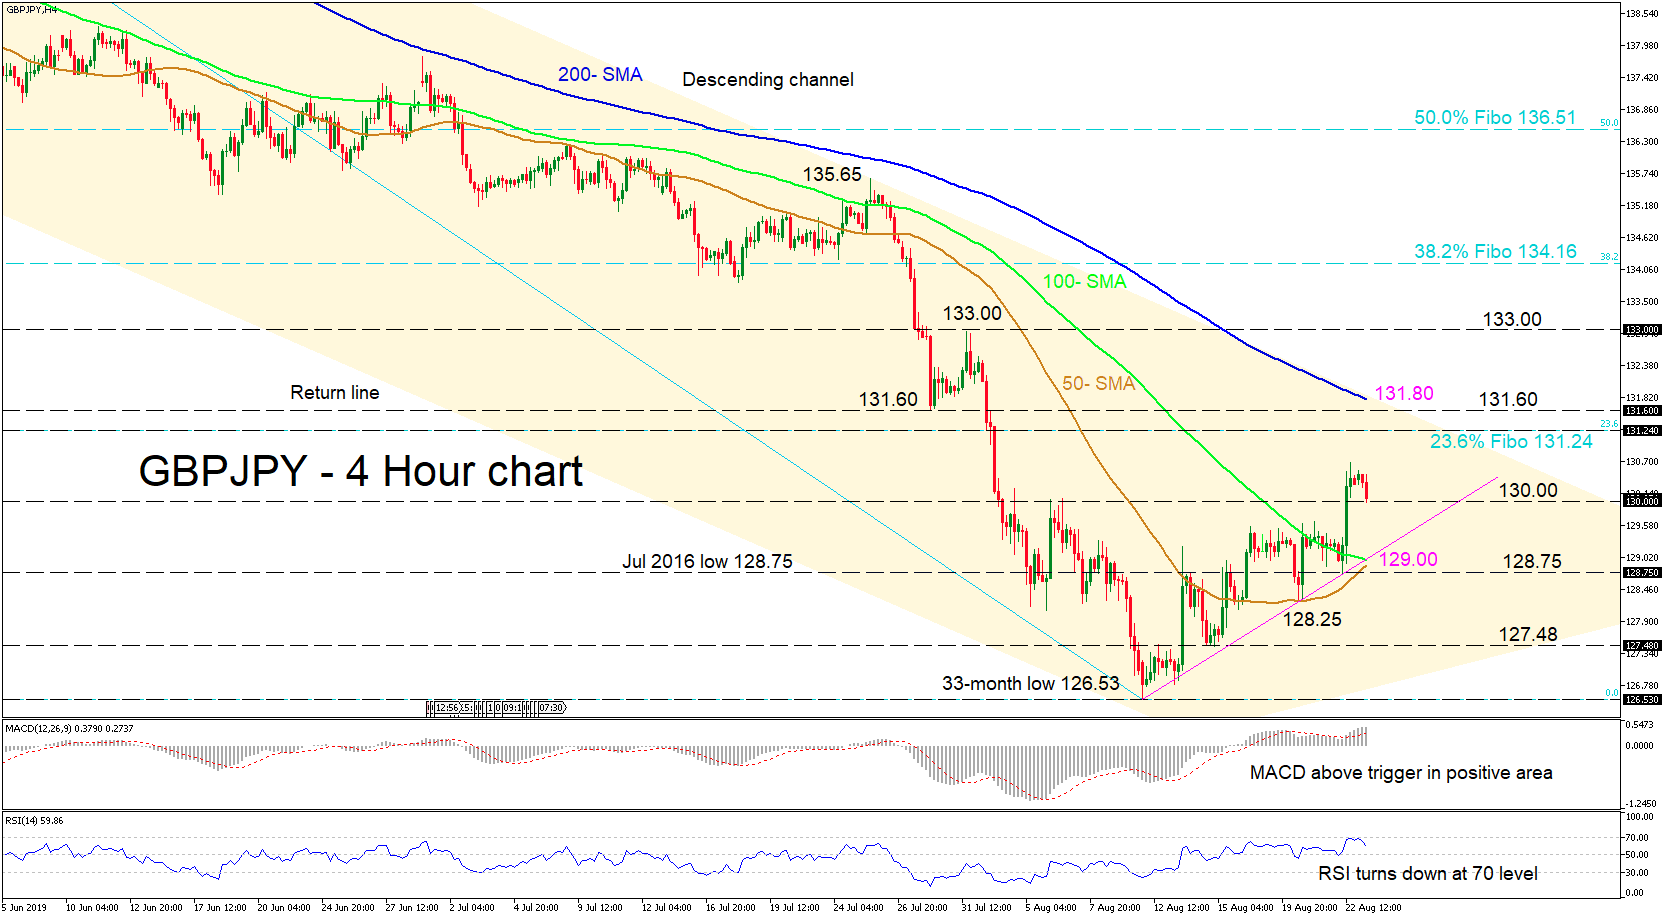
GBPJPY turned higher at a thirty-three-month low of 126.53 on August 12, of a three-month descending channel plotting higher highs and lows. Currently at the 130.00 level, the bears are trying for a push lower as reflected by the momentum indicators.
The RSI has deflected off the overbought level and is headed south, whilst the MACD has started to flatten above its red trigger line in the positive territory, both suggesting some weakening in positive momentum. In spite of this, the price is showing that a bullish picture could evolve as the 50-period simple moving average (SMA) is trying to complete a bullish cross of the 100-SMA.
If the 130.00 handle holds, the price could thrust higher to test the 131.60 resistance, where the upper boundary of the descending channel has merged with the 200-period SMA. Note that the 131.24 level could stall the move to the 200-SMA, which is the 23.6% Fibonacci retracement level of the down leg from 146.50 to 126.53. Penetrating above the channel, the 133.00 resistance from the swing high on July 31 could unfold.
If the bears show their claws and push back below 130.00, the move down could pause at the 50- and 100-SMA around 129.00, where the short-term uptrend line also lies. Even lower, the next target could be the 128.75 zone, before the swing low of 128.25 comes into view.
Overall the bigger picture is bearish, but a close above the 135.65 level could turn the bias back to neutral.


