
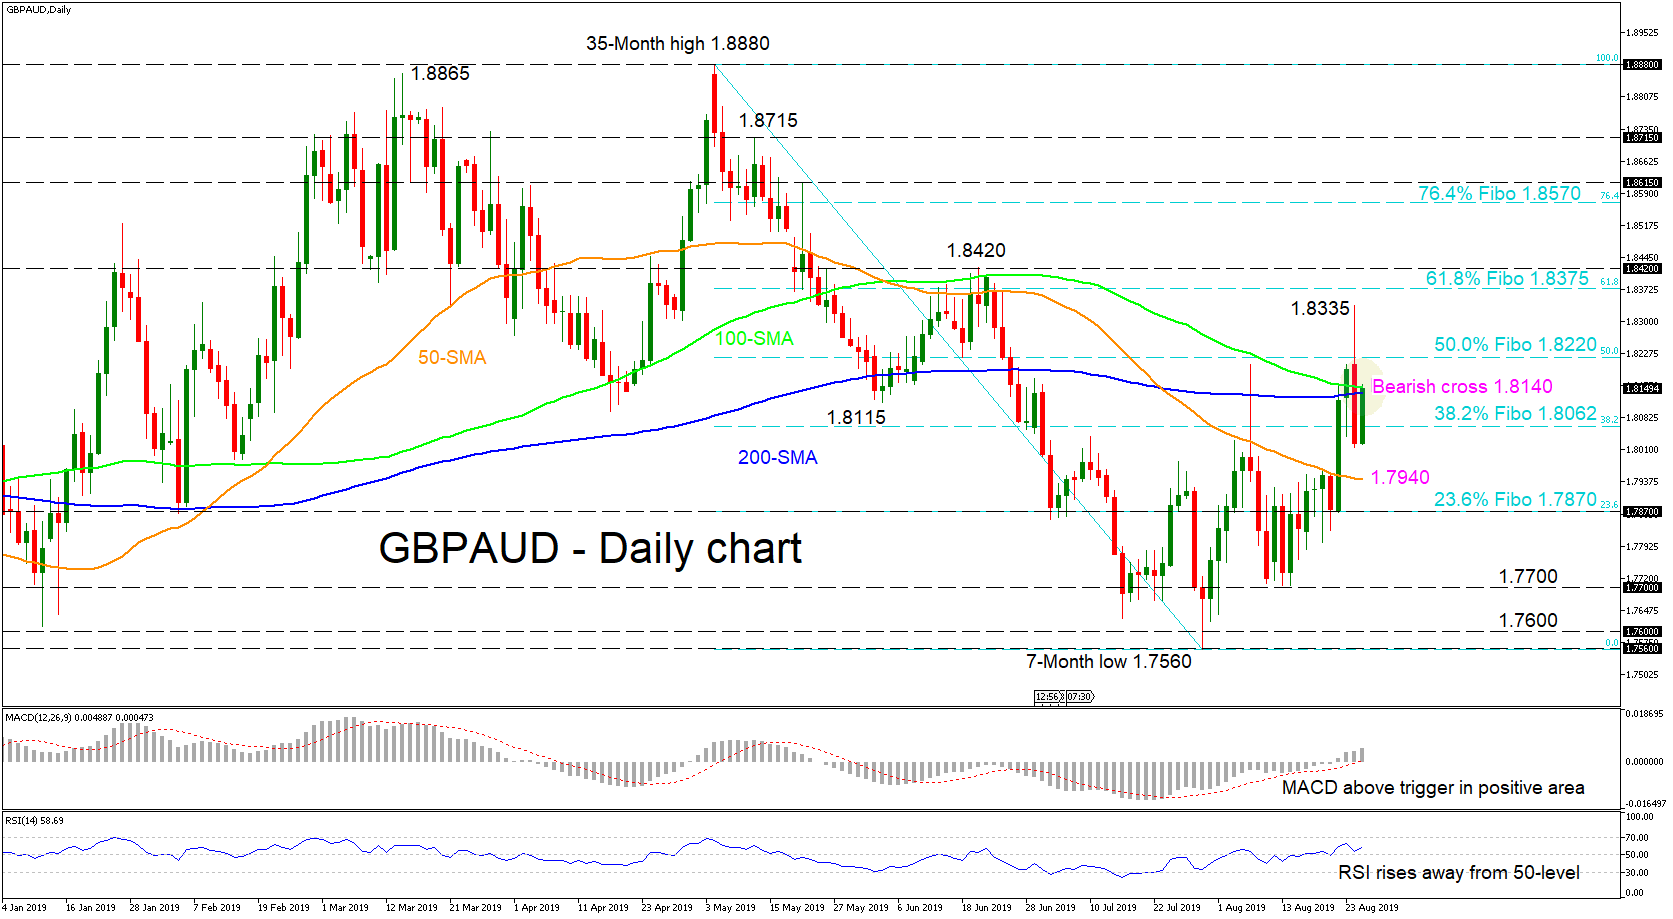
GBPAUD rose over the last month and breached the 100- and 200-day simple moving averages (SMAs) to peak at 1.8335 on Monday. The sellers, however, came soon on board, managing to pull the price back below.
Buyers are again looking for a move higher now, something also reflected by the momentum indicators. The MACD distanced itself further above its red trigger line as it entered positive territory, whilst the RSI is currently turning upwards and away from the 50-level. Despite these positive signals, traders should be cautious of a bearish cross between the 100- and the 200-day SMAs, that could revive a bearish move, sending the pair lower.
If the bears manage to take control again and move through 1.8062, which is the 38.2% Fibonacci retracement level of the down leg from 1.8880 to 1.7560, some footing could be provided by the 50-day SMA presently at 1.7940. Falling lower, support could be next detected near the 23.6% Fibo of 1.7870 before the bears could test the 1.7700 barrier. A violation of 1.7700, may have the pair home in on the 1.7600 psychological number, while lower the seven-month low of 1.7560 could be more challenging.
In case the price climbs above the 100- and 200-day SMAs, the 50.0% Fibo of 1.8220 could act as immediate resistance before attention turns to the 1.8335 high. If the positive action dominates, the 1.8420 swing high could unfold, once the 61.8% Fibo of 1.8375 is surpassed.
Summarizing, the short-term bullish bias is still in place, but caution for a rekindled down move from the SMAs would be wise.


