
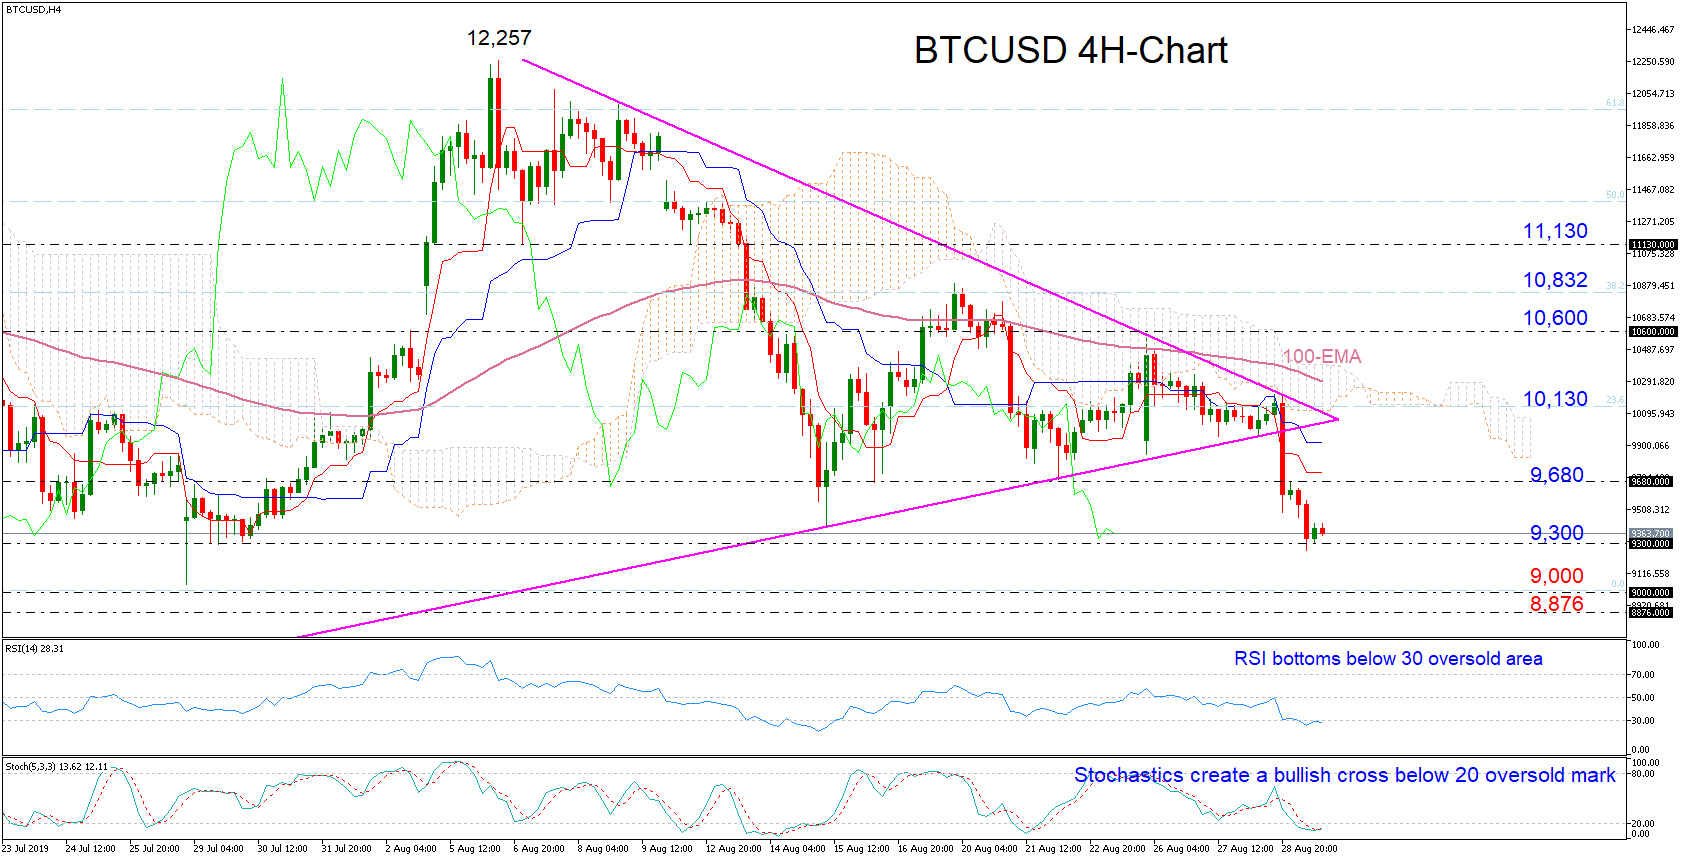
BTCUSD (Bitcoin) breached a symmetrical triangle to the downside on Wednesday in the four-hour chart and plunged to the 9,300 support-area – a negative trend signal. The fast-Stochastics and the RSI signal, however, have bottomed in the oversold territory and are turning higher, hinting that a rebound may be around the corner.
A move northward could initially pause around the 9,680 barrier and then somewhere between the 23.6% Fibonacci of 10,130 of the downleg from 13,809 to 9,011 and the 50-period exponential moving average (EMA). Should the rally extend beyond the latter, worries over a down-trending market would cease and resistance could run up to the August 26 peak of 10,600. Slightly higher, the 38.2% Fibonacci of 10,832 could also reject the bulls before a tougher battle starts near 11,130.
In case negative forces take over, traders could look for support within the 9,000-8,876 area, while slightly lower the May barrier of 8,367 could halt downside movements as well. Moving deeper, the next stop could be within the 7,650-7,400 zone.
In brief, BTCUSD looks oversold in the daily chart, facing negative trend signals as well.


