
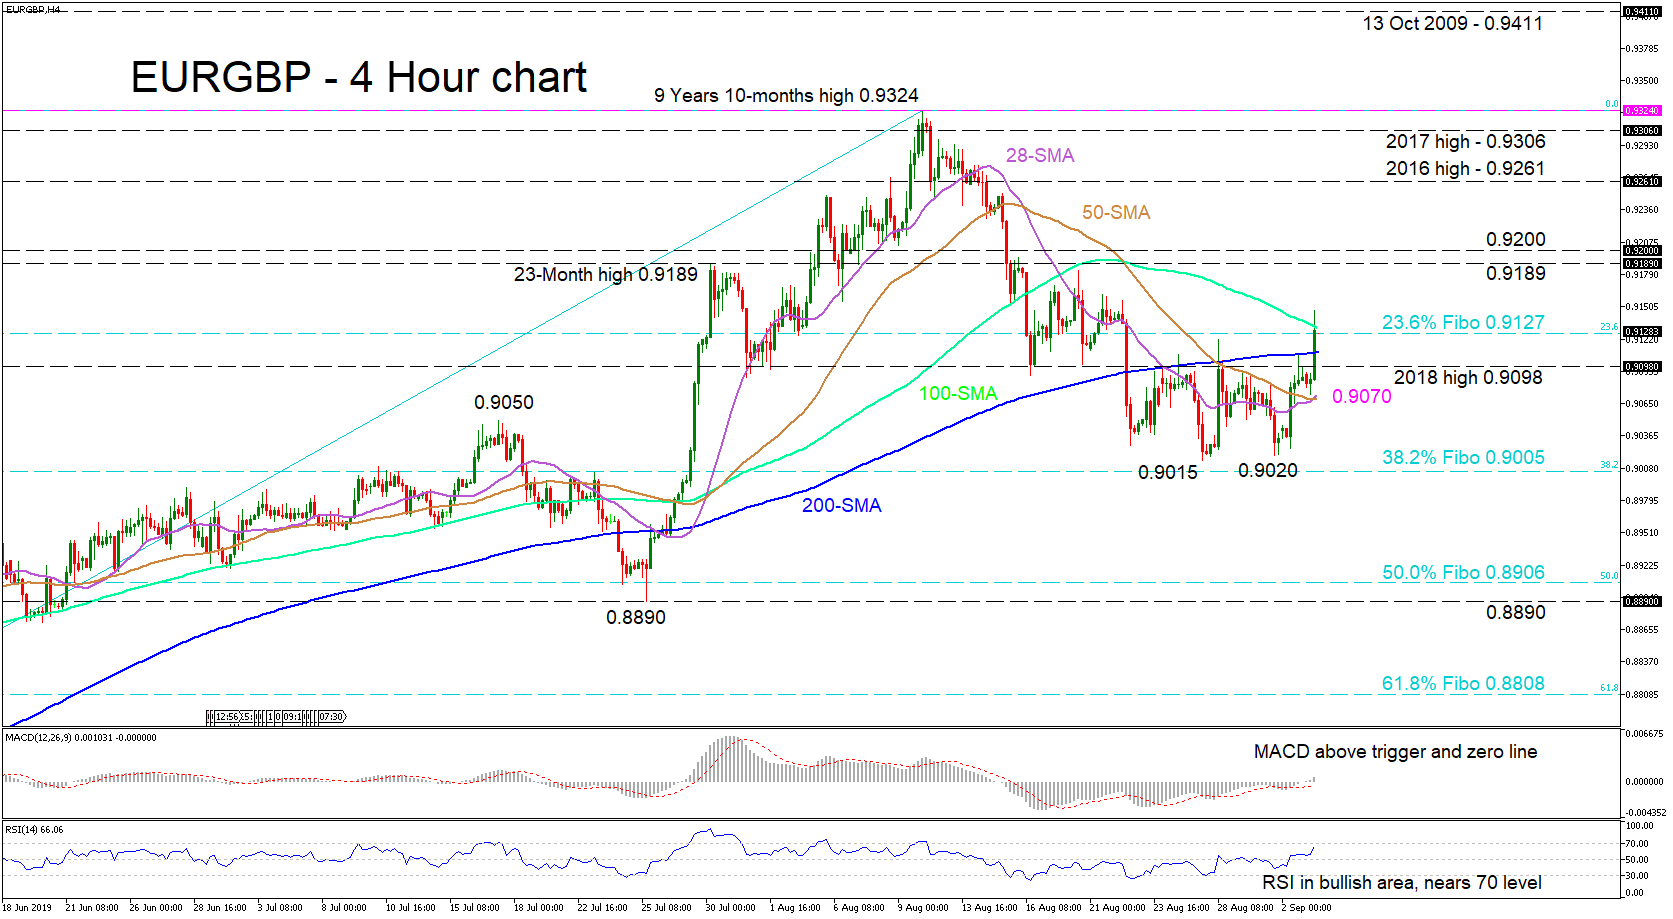
EURGBP declined over the last three weeks to levels just above the 0.9000 psychological number, forming a base for the lows. Bulls brought ammunition yesterday pushing above the 2018 high of 0.9098. Overcoming the 200-period simple moving average (SMA) and the 0.9127 level, which is the 23.6% Fibonacci retracement level of the up leg from 0.8490 to 0.9324, they then encountered the 100-period SMA wall slightly higher.
Although the 100-period SMA is declining, the 28- and 50-period SMA, which have completed a bullish cross, reflect positive momentum. Concurring, the MACD is strengthening above its red trigger line into the positive zone, while the RSI located in bullish territory, is heading for overbought regions.
Surpassing the 100-period SMA, the pair could rise to a resistance region of 0.9189 to 0.9200, the former being levels from September 2017. If the bulls dominate, the 2016 high of 0.9261 could provide some pressure, followed by the 2017 high of 0.9306. Climbing higher could have the price retest the nearly 10-year high of 0.9324, and if violated traders could see a run up to the October 2009 level of 0.9411 unfold.
If the 100-period SMA keeps the bulls at bay, a shove below the 200-period SMA and 0.9100 support hurdle could have price stall at the 0.9070 area, where the bullish cross of the SMAs lies. Falling further, if the bears manage to move past the more important 38.2% Fibo of 0.9005, price could then come to rest at the 50.0% Fibo of 0.8906.
Overall, the bullish bias in the short-term persists. However, a close below 0.8890 could shift the sentiment in the short- and medium-term, back to neutral.


