
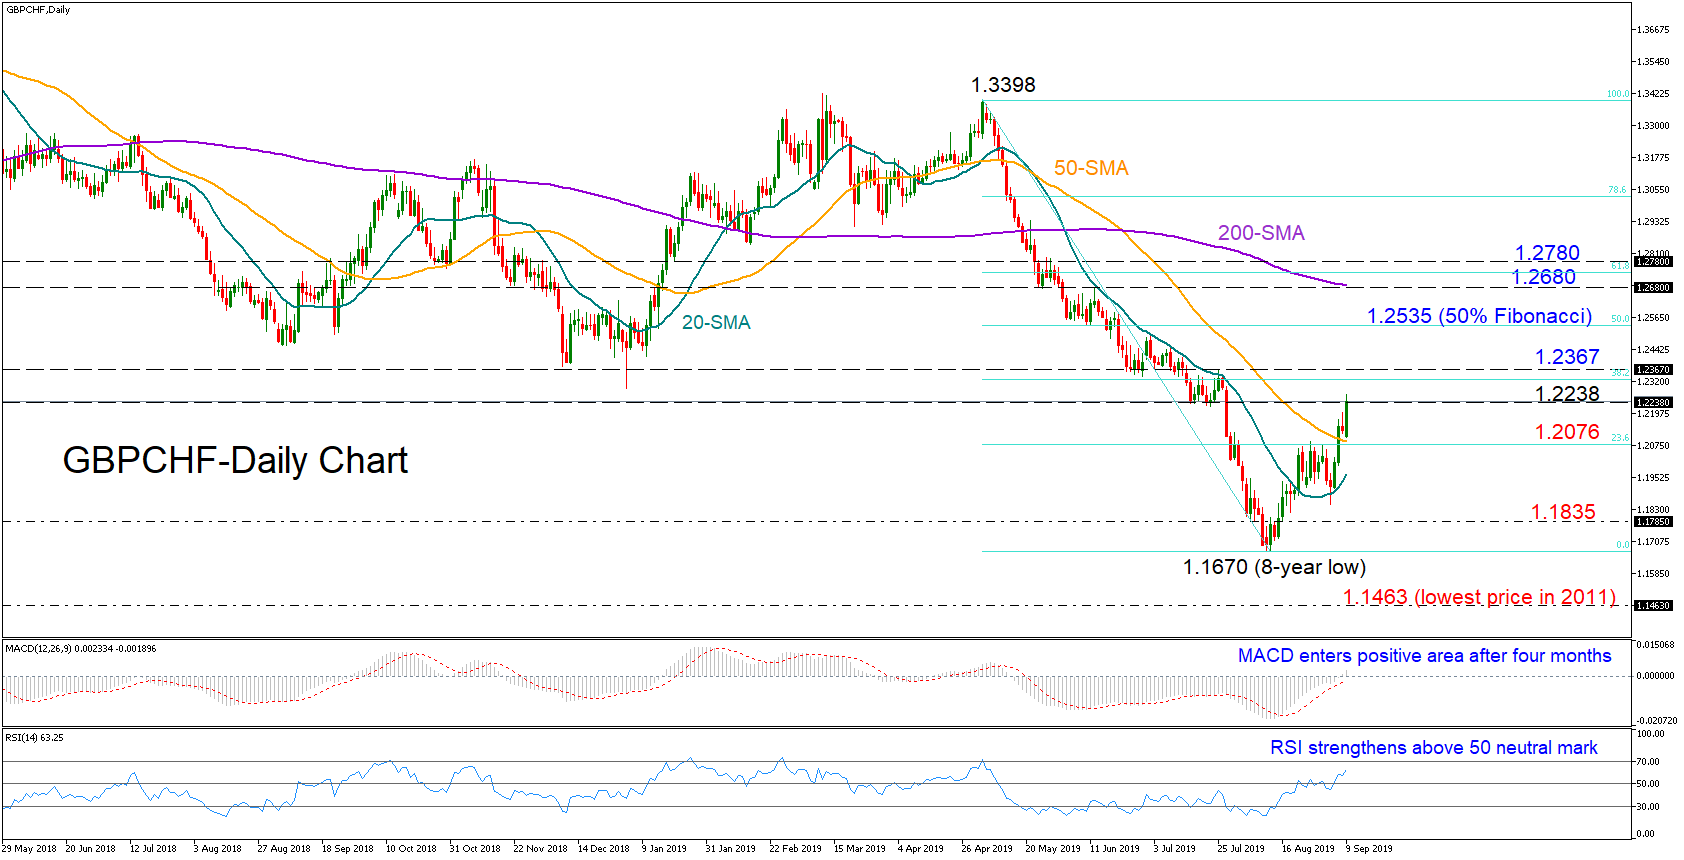
GBPCHF is looking for more buyers to sign up in the short-term as the MACD tries to grow in the positive territory for the first time since April and the RSI is picking up steam in the bullish area.
The market is currently making efforts to pierce July’s troughs around 1.2238, though only a bullish explosion above the previous high of 1.2367 would bring the four-month old downtrend in speculation. A step above 1.2535, which is the 50% Fibonacci of the downleg from 1.3398 to 1.1670, could add more legs to the rally, allocating resistance within the 1.2680-1.2780 region, where the 200-day simple moving average and the 61.8% Fibonacci happen to be. Further up, traders could view the medium-term picture as neutral.
Alternatively, should the price pull back below the 50-day SMA and the 23.6% Fibonacci of 1.2076, the 20-day SMA could provide nearby support before the 1.1835-1.1670 zone appears in the radar. Driving downtrend below the 8-year low of 1.1670, sellers would search for new bottoms around the 2011 trough of 1.1463.
Summarizing, GBPCHF could cement its recent rebound above 1.2367, while in the medium-term picture traders would ask for a closing price above 1.2780 to adjust bearish sentiment to neutral.


