
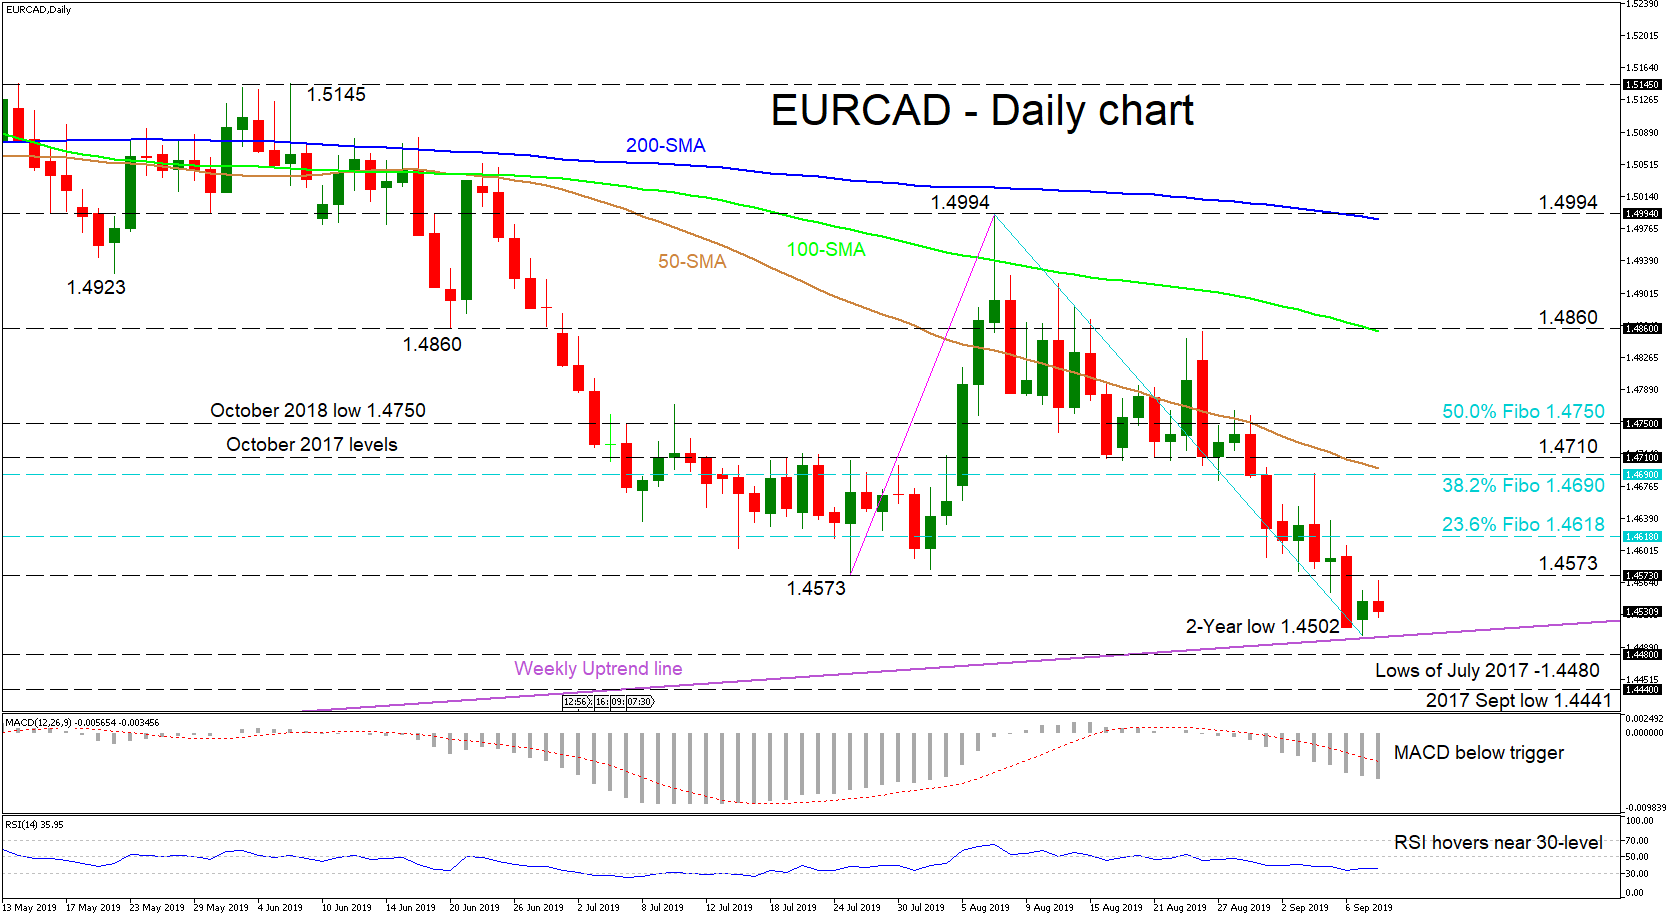
EURCAD descended over the last month from the peak of 1.4994, after failing to close above the 100-day simple moving average (SMA), with the bears eyeing the weekly uptrend line drawn from 1.2127 on the 12 of August 2012. They failed to penetrate below, only managing to produce a 2-year low of 1.4502 and reversed after finding support on the line.
The MACD has distanced itself from its red trigger line in the negative zone, reflecting an increase in bearish momentum, thus concurring with the downward sloping SMAs negative outlook. The RSI, on the other hand, warns of a possible pause in the bearish move, as it is flattening above the oversold region.
If the weekly uptrend line holds and the bulls reemerge, the price could find initial resistance from the 1.4573 level, before moving to test 1.4618, which is the 23.6% Fibonacci retracement of the down wave from 1.4994 to 1.4502. If the ascent persists, the resistance region of 1.4690 to 1.4710 – which encapsulates the 50-day SMA – could prove to be a stronger adversary. Conquering the region, the 50.0% Fibo of 1.4750 may apply some pressure, before the swing high of 1.4860.
If sellers come back and manage to break below the trendline around the 1.4500 handle, a test of the down move could next come from the lows of July 2017 at 1.4480 and the 2017 September low of 1.4441.
Overall, the short-term outlook remains bearish and a break below the trendline and the 1.4441 low would cement it.


