
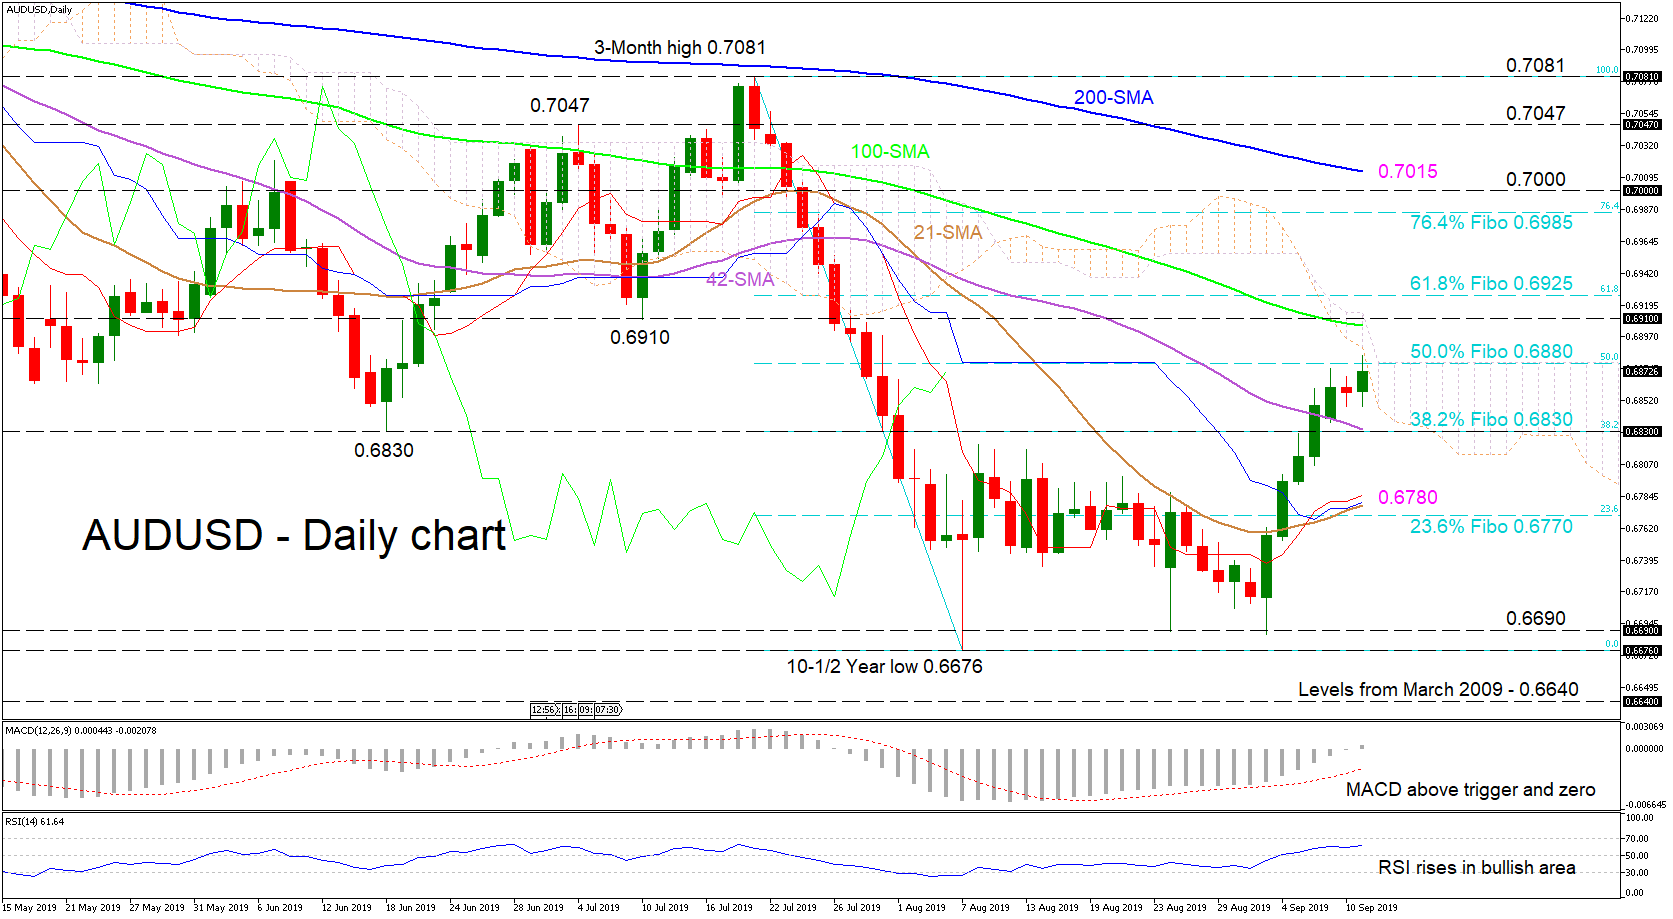
AUDUSD has rallied above the 21- and 42-day simple moving averages (SMAs), up to the Ichimoku cloud, after the bears were unable to capitalize from the multi-year lows it re-tested earlier this month. Tackling 0.6880, which is the 50.0% Fibonacci retracement level of the down leg from 0.7081 to 0.6676, buyers are looking to take back more losses from the drop which started on July 19.
The MACD has distanced itself from its red trigger line moving marginally into the positive region, while the RSI after rising into bullish territory has flattened. Noteworthy, is the bullish cross of the Tenkan-sen and Kijun-sen lines, whose slopes have merged with the recent up-turn in the 21-day SMA.
Should the bulls push above the 50.0% Fibo of 0.6880 and through the Ichimoku cloud, the 100-day SMA and 0.6910 resistance level could test the move, ahead of the 61.8% Fibo of 0.6925. Higher, the resistance region of 0.6985 – 0.7000 could apply some tension, before facing the 200-day SMA around 0.7015.
If the 50.0% Fibo of 0.6880 holds and the bears penetrate below the 38.2% Fibo of 0.6830 coupled with the 42-day SMA, the price could decline to the support area of 0.6780 – 0.6770, where the 21-day SMA and 23.6% Fibo reside. If the bears reappear, a drive to revisit the multi-year lows of 0.6690 and 0.6676 could unfold, which, if surpassed, could rekindle the bearish trend.
Overall, the downward sloping 42-,100- and 200-day SMAs are countering the growth of a bull market. For the positive picture in the short-term to be confirmed, the price would need to overcome the peak of 0.7081.


