
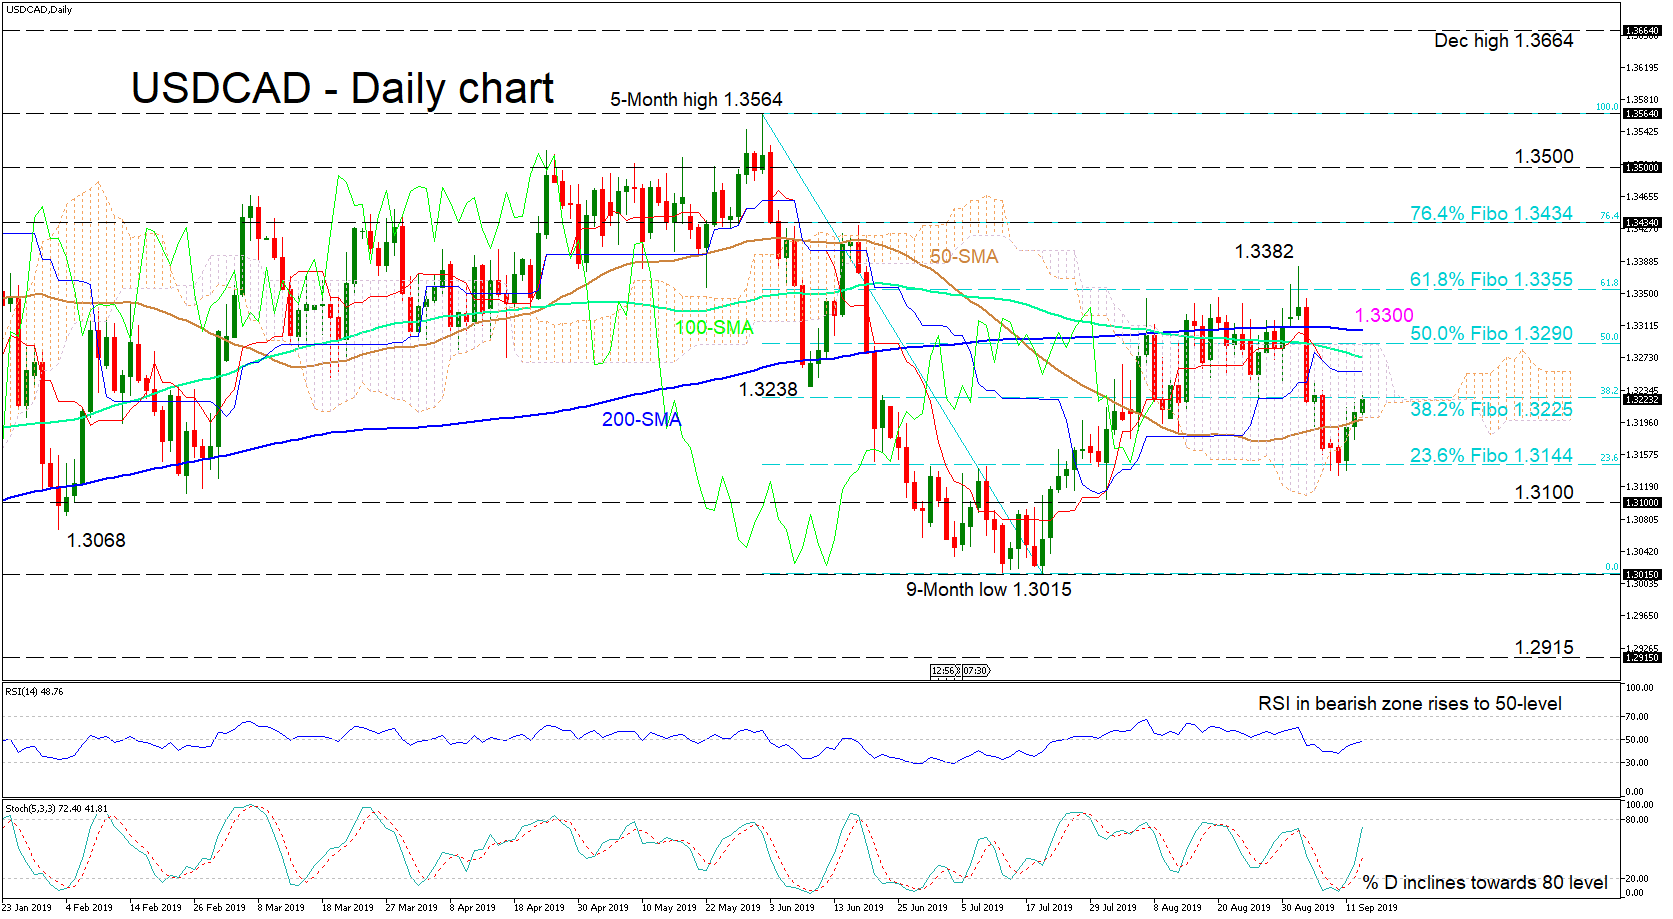
USDCAD bulls shot above the 200-day simple moving average (SMA) on September 3, but it seems that the bullet was a dud. The bears reversed underneath the 1.3355 resistance, which is the 61.8% Fibonacci retracement level of the down move from 1.3564 to 1.3015, and more importantly the 200- and 100-day SMAs. It seems like a cease fire is developing, as the SMAs and the Kijun-sen are adopting a horizontal picture, with buyers driving back into the Ichimoku cloud.
The stochastics have rebounded sharply, fast approaching the overbought level, while the RSI is close to reclaiming the 50 level. The momentum indicators’ short-term bullish outlook contradicts the bigger neutral picture suggested by the SMAs.
Pushing over the 38.2% Fibo of 1.3225, resistance could come from the Kijun-sen and 100-day SMA ahead of the 50.0% Fibo of 1.3290, where the upper boundary of the cloud also lies. Higher the 200-day SMA, around the 1.3300 handle, could play its part in hindering the move up to test the more durable 61.8% Fibo of 1.3355. Surpassing it could see the 76.4% Fibo of 1.3434 unfold.
If the 38.2% Fibo of 1.3225 holds and the bears thrust beneath the 50-day SMA and the Ichimoku cloud, support could come at the 23.6% Fibo of 1.3144 ahead of the 1.3100 psychological number. Steering lower, a revisit of the nine-month low of 1.3015 could unravel.
Overall, the pair seems to be stuck in a sideways market between 1.3144 and 1.3355 and a break below or above, would reveal the directional bias.


