
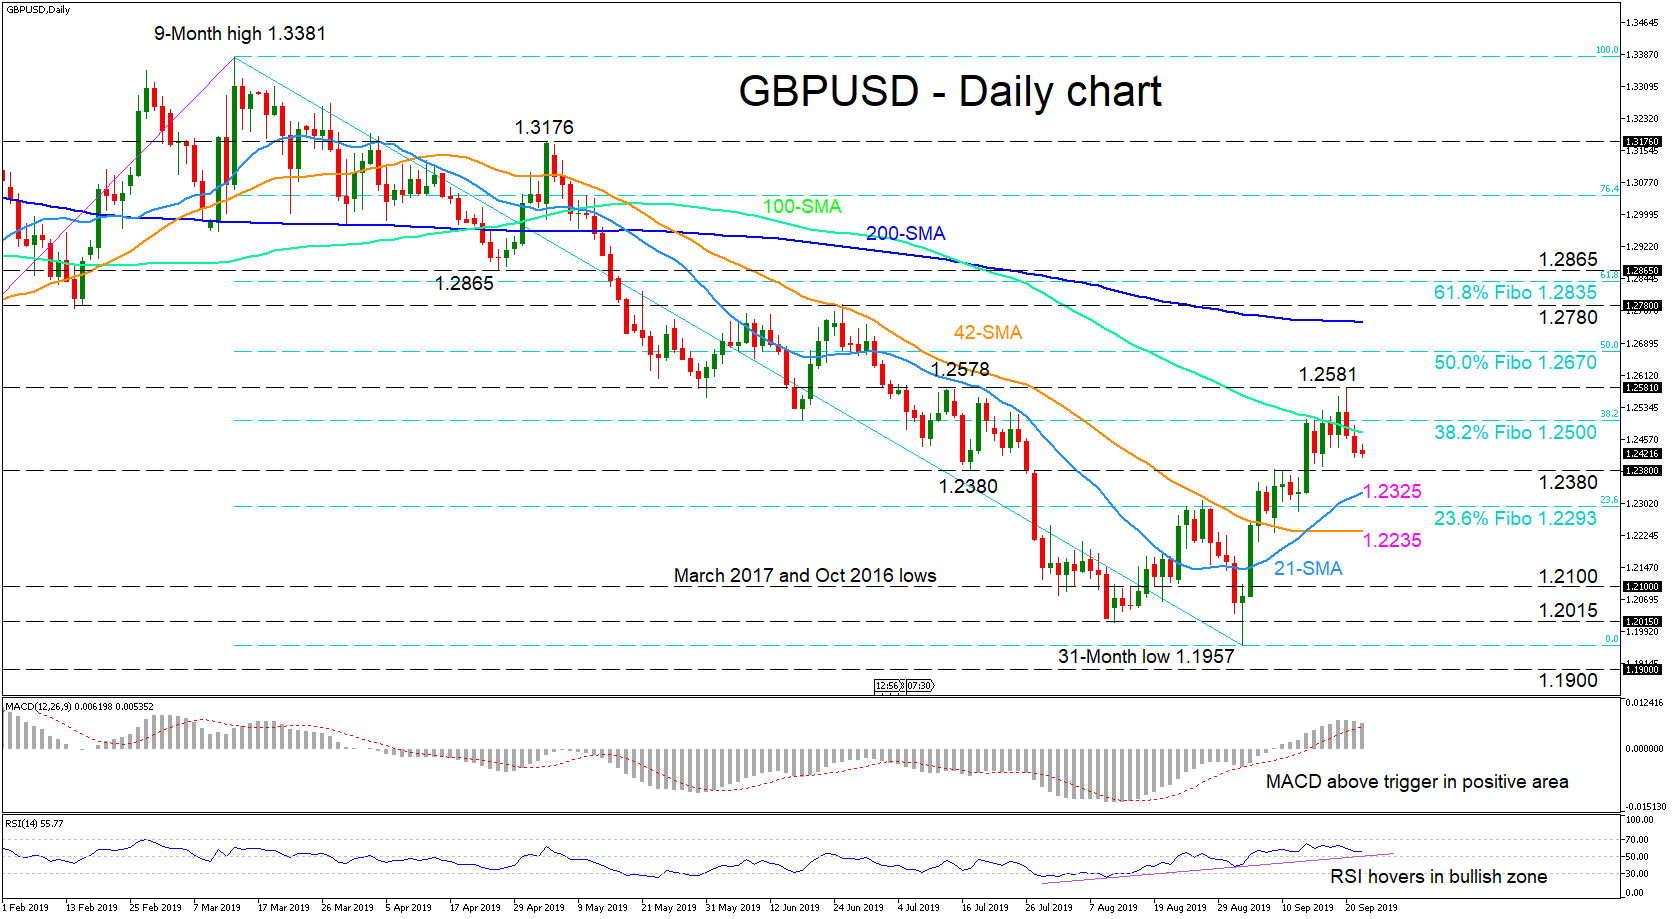
GBPUSD bears took control, pivoting the pair around the swing peak of 1.2578 from July 12. The price correction has slipped underneath the 1.2500 hurdle and the 100-day simple moving average (SMA), the former being, the 38.2% Fibonacci retracement of the down leg from 1.3381 to 1.1957.
Momentum indicators are starting to fall in line with the bigger bearish picture. The MACD is declining towards its red trigger line in the positive zone and the RSI is horizontal near the 50-level, both reflecting decreasing positive momentum. Traders need to be aware though, of the still inclining 21-day SMA and the 42-day SMA, which has flattened, both still backing the short-term upside outlook.
If the bears continue to push lower, first to apply the pressure is the 1.2380 support coming from the trough of July 17. Breaching this, the 21-day SMA around 1.2325 could stall the drop to test the 23.6% Fibo of 1.2293. Penetrating beneath it, may have sellers reappear, steering the price towards the 1.2100 handle, once the 42-day SMA is overcome.
In the positive scenario, a jump back above the 100-day SMA and the 38.2% Fibo of 1.2500 could bring the peak of 1.2581 back into the spotlight. Surpassing it, could see the 50.0% Fibo step up to the plate at 1.2670. Next, the 200-day SMA and then the 1.2780 resistance could draw traders’ attention.
Overall, the medium-term sustains a bearish outlook. A break above the 1.2581 peak would revive the short-term bullish bias, while above the 1.2780, the medium-term would shift to neutral.


