
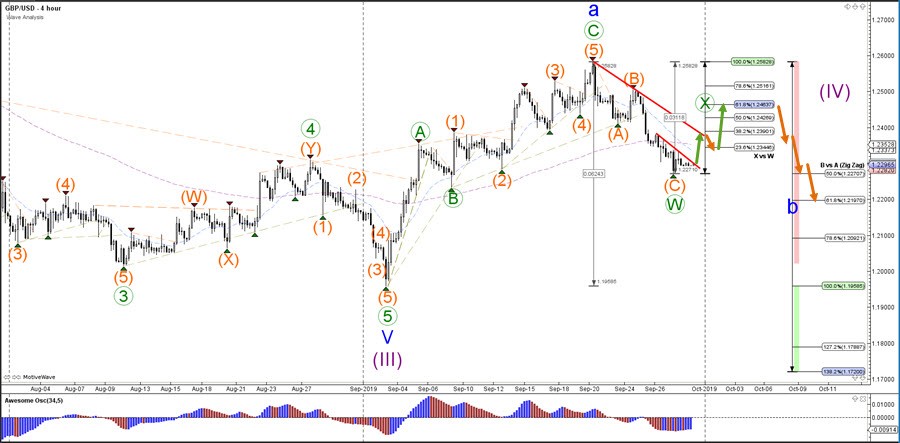
The GBP/USD could build a bullish ABC pattern as part of a larger WXY (green) correction of wave B (blue). The key levels to keep an eye on are the resistance trend lines (red) and Fibonacci levels of wave X vs W and B vs A. As long as price stays below the 100% Fib of wave X vs W, a bullish ABC within wave X is still valid. An immediate breakout below the 50% Fib of wave B vs A could indicate a deeper wave C (orange).
The GBP/USD could have completed a 5th wave (dark red) of bearish wave C (orange) at 1.2270 support zone. This becomes more likely if price is able to confirm the bullish wave C (orange) with a bull breakout towards the Fibonacci targets. A bearish breakout below the support line (blue) indicates an expanded wave 5 (dark red) and wave C (orange).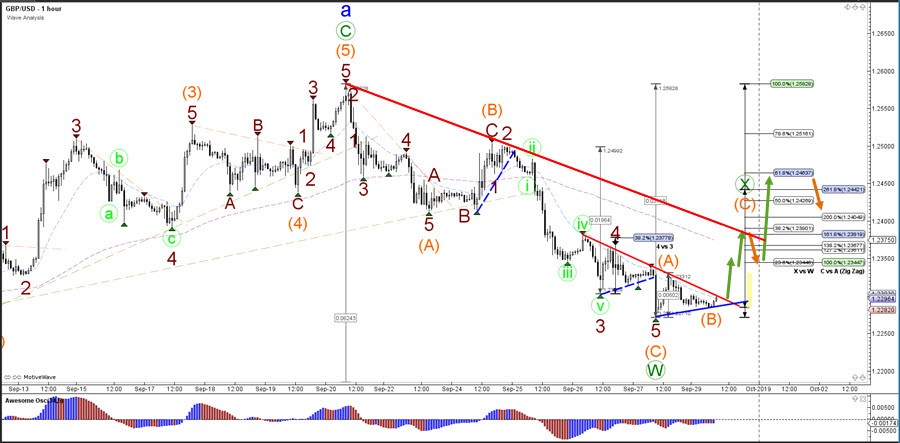


