
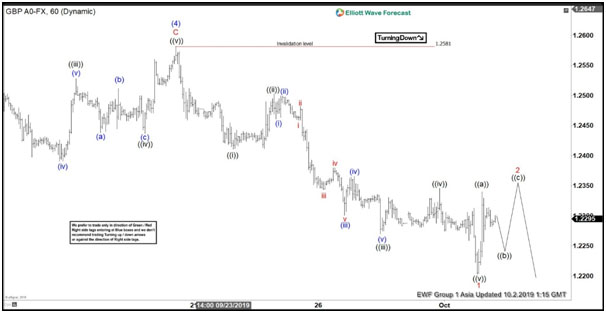
Short term Elliott Wave view on $GBP/USD suggests the rally to 1.258 on September 20, 2019 high ended wave (4). Pair has since turned lower within wave (5) which is unfolding as 5 waves impulse Elliott Wave structure. Down from 1.258 high, wave ((i)) ended at 1.241 and wave ((ii)) bounce ended at 1.25. Pair then resumed lower again and ended wave ((iii)) at 1.227. Wave ((4)) bounce ended at 1.234 and wave ((5)) lower ended at 1.22. The entire 5 waves move lower ended wave 1 in higher degree.
Pair should bounce in wave 2 to correct cycle from September 20 high before the decline resumes. Wave 2 is proposed to unfold in a zigzag structure where wave ((a)) ended at 1.234. Expect a wave ((b)) pullback followed by another leg higher in wave ((c)) before ending wave 2. Afterwards, pair should resume lower again at least for another leg lower which subdivides in 5 waves. We don’t like buying the pair. As far as pivot at 1.258 high stays intact, expect bounce to fail in 3, 7, or 11 swing for further downside.
GBP/USD 1 Hour Elliott Wave Chart


