
SP 500 (SPX) has been sideways since January 2018 and it’s also sideways more recently since July 26 high. After forming peak at January 22, 2018 at 2872, the Index managed to make two more marginal highs. However, each time, the new marginal high lose the momentum and pullback again.
Current short term outlook suggests the rally to 3022 ended wave (1) and the decline to 2855.6 ended wave (2). In this proposed count, the Index should then be in wave (3) as a 5 waves impulse Elliott Wave structure. Up from 2855,64, wave 1 should end soon as 5 waves in lesser degree. Wave ((i)) ended at 2959.75 and wave ((ii)) pullback ended at 2892.66. Index then resumed higher in wave ((iii)) towards 3003.28 and wave ((iv)) pullback ended at 2985.20.
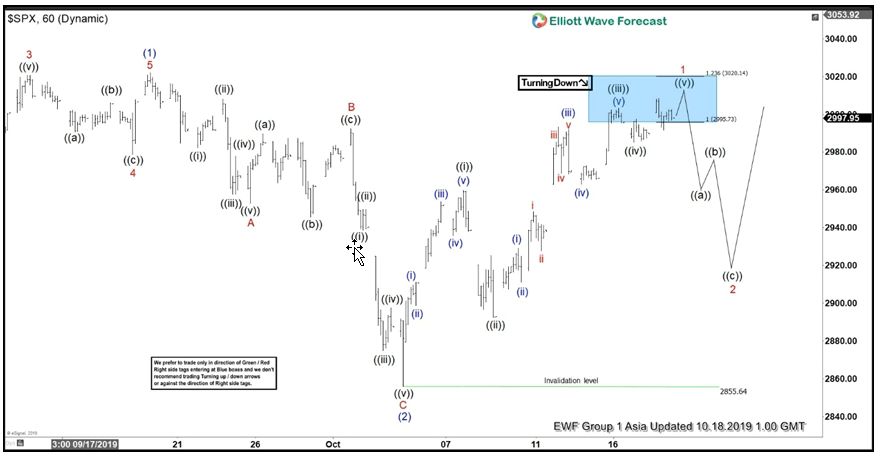
Expect Index to end wave ((v)) of 1 soon, then it should pullback in wave 2 to correct cycle from October 3 low (2855.64) before the rally resumes. The Index still needs to break above wave (1) at 3022 to validate this bullish view. As far as pivot at 2855.64 low stays intact in the dips, expect Index to extend higher.
SPX (SP 500) 1 Hour Elliott Wave Chart


