
Key Highlights
- The Euro started a fresh decline from the 1.1175 resistance against the US Dollar.
- EUR/USD traded below a crucial bullish trend line at 1.1110 on the 4-hours chart.
- GBP/USD also declined and broke the key 1.2800 support area.
- UK’s GDP is likely to grow 0.3% in Q3 2019 (Preliminary) (QoQ).
EUR/USD Technical Analysis
The Euro faced a strong resistance near the 1.1175 area against the US Dollar. As a result, EUR/USD started a fresh decline below the 1.1150, 1.1120 and 1.1080 support levels.
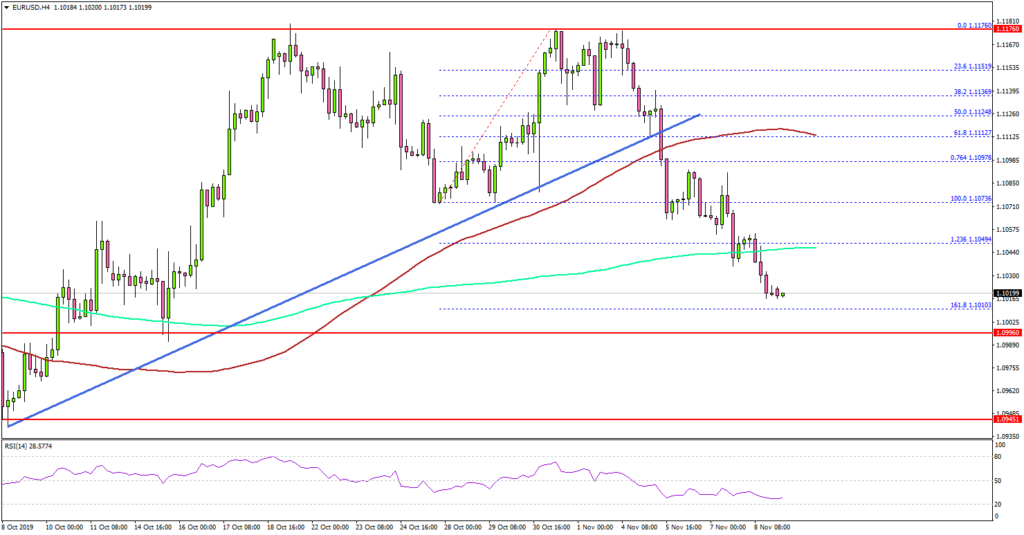
Looking at the 4-hours chart, the pair declined heavily below the 1.1080 and 1.1050 support levels. Moreover, there was a close below the 100 simple moving average (red, 4-hours) and the 200 simple moving average (green, 4-hours).
More importantly, the pair traded below the 1.1073 swing low, plus the 1.236 Fib extension level of the upward move from the 1.1073 low to 1.1176 high.
It opened the doors for more losses below 1.1040. An immediate support is near the 1.1000 area or the 1.618 Fib extension level of the upward move from the 1.1073 low to 1.1176 high.
Any further losses may perhaps push EUR/USD towards the 1.0980 support area. On the upside, there are many hurdles on the upside near the 1.1050 and 1.1060 levels, above which the pair could revisit 1.1100.
Similarly, there were bearish moves in GBP/USD below the 1.2850 and 1.2800 support levels. Conversely, USD/JPY remains in an uptrend above 108.00.
Upcoming Economic Releases
- UK Industrial Production for Sep 2019 (MoM) – Forecast -0.1%, versus -0.6% previous.
- UK Manufacturing Production for Sep 2019 (MoM) – Forecast -0.2%, versus -0.7% previous.
- UK GDP Q3 2019 (Preliminary) (QoQ) – Forecast +0.3%, versus -0.2% previous.


 Interventions?")


