
Key Highlights
- Gold price is declining and it recently traded below $1,460 against the US Dollar.
- A key bearish trend line is forming with resistance near $1,462 on the 4-hours chart of XAU/USD.
- UK’s ILO Unemployment rate declined from 3.9% to 3.8% in Sep 2019 (3M).
- The US CPI could increase 1.7% in Oct 2019 (YoY), similar to the last reading.
Gold Price Technical Analysis
Earlier this month, gold price failed to climb above the $1,515 resistance against the US Dollar. As a result, the price started a fresh decline and traded below many supports near $1,500 and $1,480.
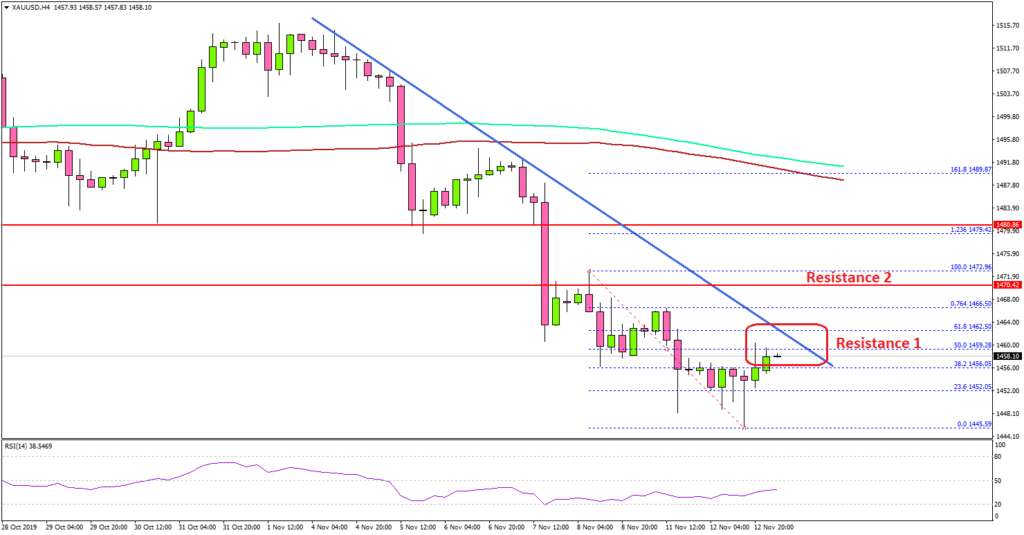
The 4-hours chart of XAU/USD indicates that the price declined steadily after it broke the $1,480 support area. Moreover, the price settled well below the $1,480 level, the 100 simple moving average (4-hours, red), and the 200 simple moving average (4-hours, green).
Finally, the price moved below the $1,460 support and tested the $1,450 support area. At the moment, the price is consolidating losses, with an immediate resistance near the $1,458 level.
The first major resistance is near the $1,460 level, plus the 50% Fib retracement level of the recent decline from the $1,472 high to $1,445 low.
Moreover, there is a key bearish trend line forming with resistance near $1,462 on the same chart. If there is a successful close above $1,462, the price could recover towards the $1,470 and $1,472 resistance levels.
Conversely, if there is no correction above $1,462, the price is likely to continue to lower. In the mentioned case, the price is likely to trade below the $1,448 low. The next key support is near the $1,442 and $1,440 levels.
Looking at EUR/USD, the pair extended its decline below the 1.1050 pivot level. Moreover, GBP/USD seems to be struggling to stay above the 1.2800 support area.
Economic Releases to Watch Today
- UK Consumer Price Index Oct 2019 (YoY) – Forecast +1.6%, versus +1.7% previous.
- UK Core Consumer Price Index Oct 2019 (YoY) – Forecast +1.7%, versus +1.7% previous.
- US Consumer Price Index Oct 2019 (YoY) – Forecast +1.7%, versus +1.7% previous.
- US CPI Ex Food & Energy Oct 2019 (YoY) – Forecast +2.4%, versus +2.4% previous.


