
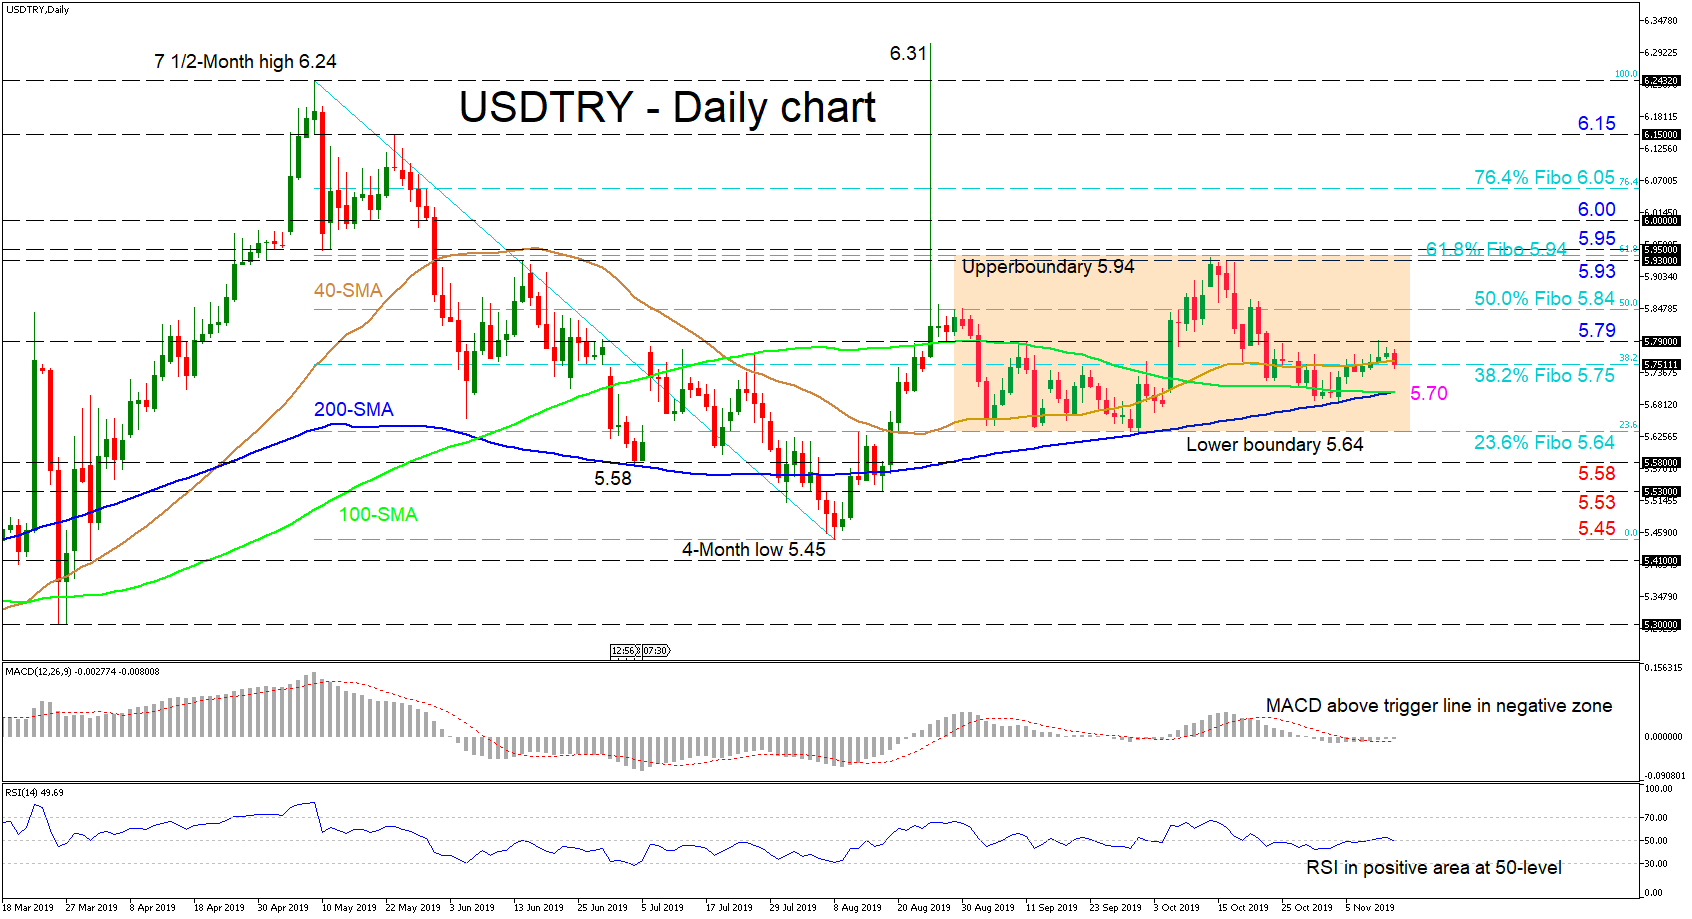
USDTRY sellers are trying to push below the 5.75 mark, which is the 38.2% Fibonacci retracement of the down leg from 6.24 to 5.45 and where the 40-day simple moving average (SMA) is currently located. The pair seems to be bound within the region of 5.94 to 5.64, which coincides with the 61.8% and 23.6% Fibo respectively.
The short-term oscillators reflect indistinct signals – trading around their neutral marks – suggesting that directional momentum has disappeared. The RSI is implying a marginal setback in positive momentum slightly above the 50-level. The MACD is in the negative region, above its red trigger line and barely below the zero line. Additionally, the SMAs reflect mixed signals, which could assist the price to continue within the range.
If sellers push below the 5.75 level, the united 100- and 200-day SMAs could restrict the drop to test the 5.64 lower boundary of the range. Piercing below, the 5.58 support could come next, before the swing low of 5.53 tries to keep the bears at bay ahead of the trough of 5.45.
To the upside, buyers initially could meet resistance from the 5.79 level before the 50.0% Fibo of 5.84. Even higher, the durable resistance region of 5.93 to 5.95 could restrict the climb to test the resistance at the 6.00 hurdle.
Overall, the short-term bias is neutral, bound between 5.94 and 5.64 and a break above or below is required to set the direction.


