
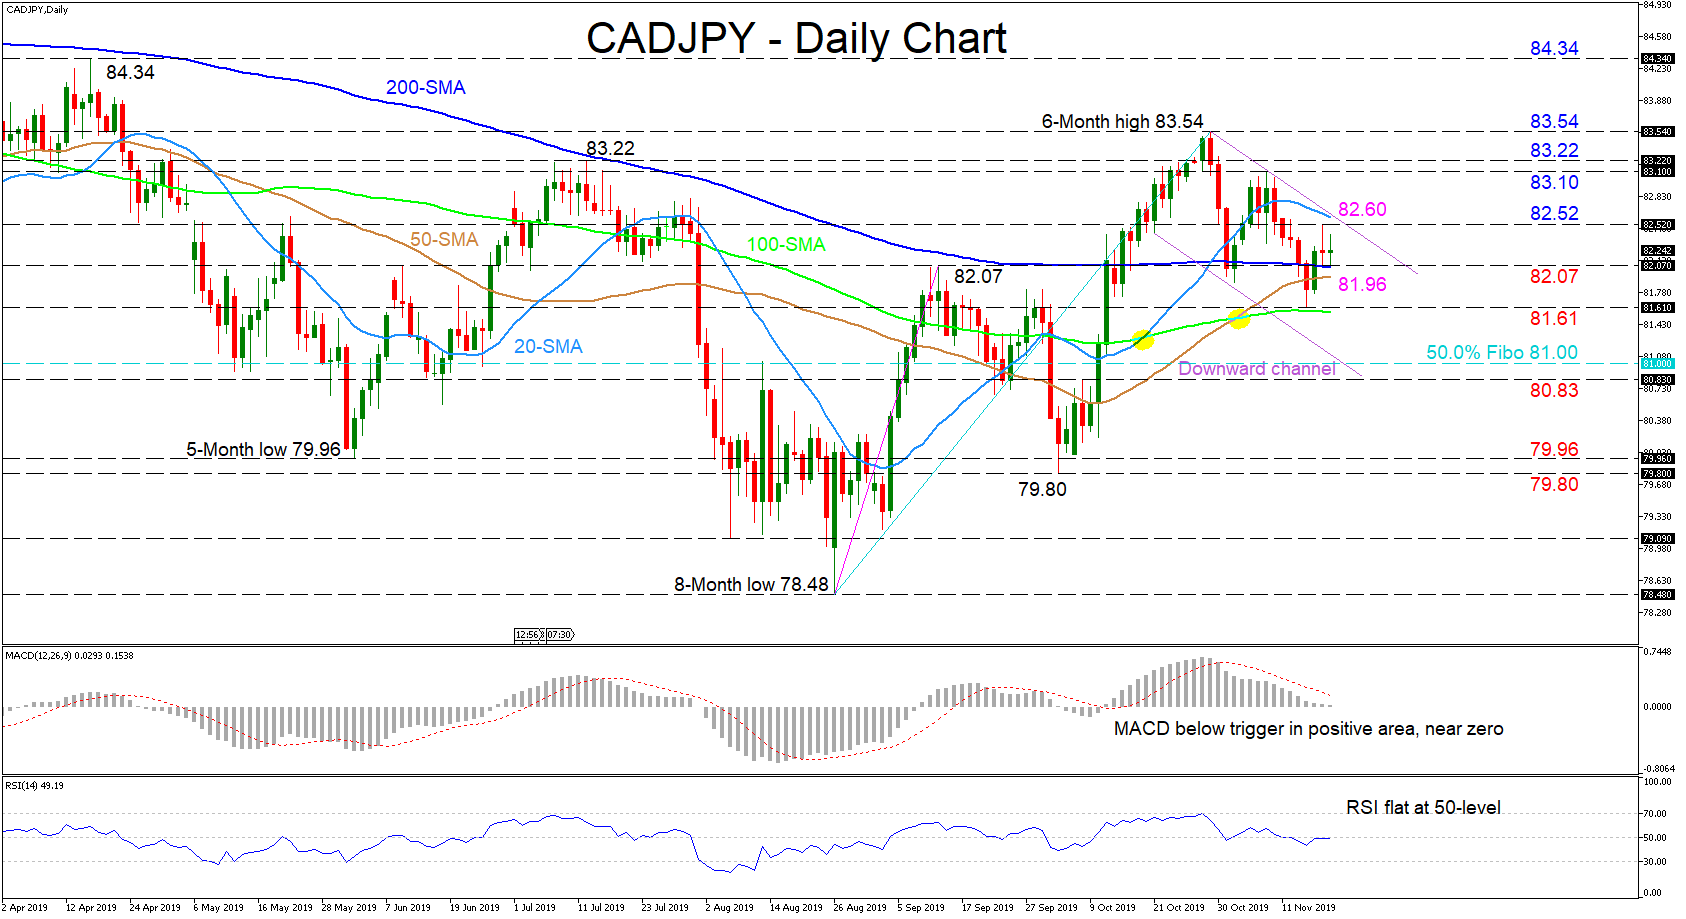
CADJPY although in a downward channel looks undecided resting on the 200-day simple moving average (SMA). Directional momentum has disappeared as reflected in the short-term oscillators with the MACD and RSI flat at their neutral marks.
Further backing this picture and implying that the pair may adopt a short-term side move are the SMAs, which are converging, with the 50-day SMA already starting to turn flat like the 100- and 200-day SMAs, while the 20-day SMA heads lower towards them.
If the price holds above the 200-day SMA at 82.07, the upper restrictive line of the downward channel around 82.52 and the 20-day SMA at 82.60 could halt further gains in an effort to test the 83.10 and 83.22 highs from November 7 and July 12 respectively. Moving higher, the six-month peak of 83.54 could then test the bull’s determination.
To the downside, if sellers steer the price below the 200-day SMA again, immediate support could come from the 50-day SMA at 81.96 ahead of the 81.61 key support where the 100-day SMA and recent swing low reside. Overtaking this as well could have price test the lower supportive line around the 81.00 to 80.83 area.
Overall, a neutral-to-bearish bias exists in the short-term and a break below the 100-day SMA would strengthen the negative sentiment. However, a break above the upper restrictive line and 83.54 peak would reinforce a bullish view.


