
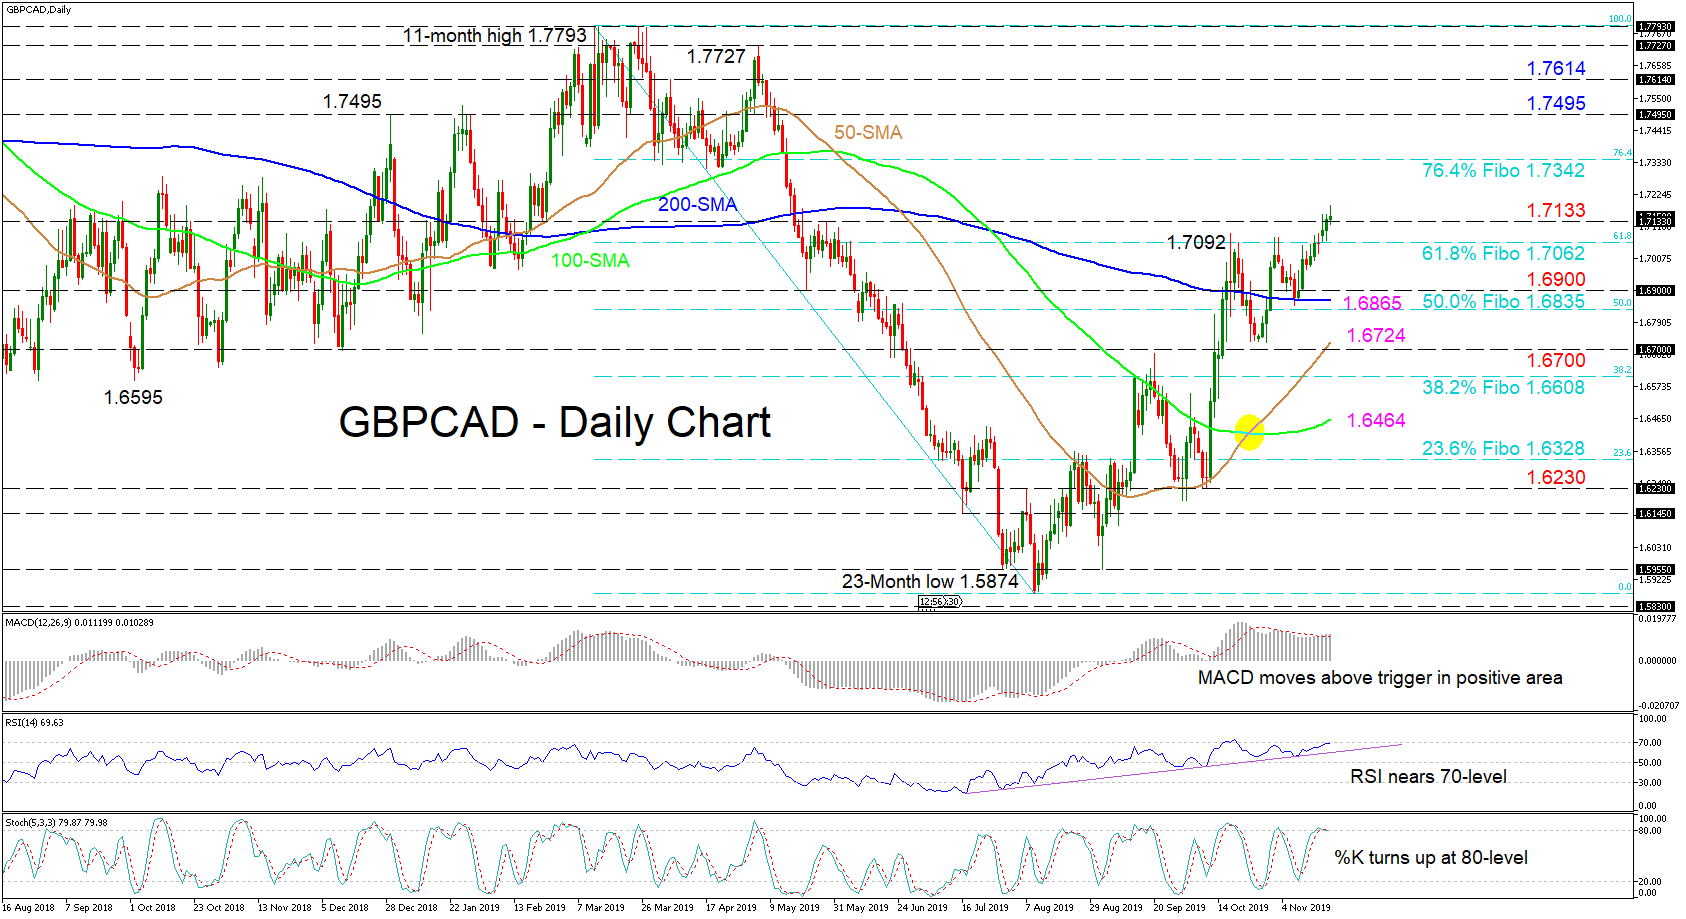
GBPCAD is pushing above a key resistance of 1.7133 from the swing high from May 29. The ascent, which commenced on August 9, is aided by the progressing bullish cross of the 50-day simple moving average (SMA) and the improving positive momentum in the technical indicators.
The short-term oscillators suggest that positive directional momentum is increasing as do the slopes of the 50- and 100-day SMAs. The MACD, in the positive zone, has moved back above its red trigger line, while the RSI is sloping upwards currently at the 70 level. However, the Stochastics are marginally in the overbought territory warning of a pullback.
To the upside, if buying continues above 1.7133, the 1.7342 resistance, which is the 76.4% Fibonacci retracement of the down wave from 1.7793 to 1.5874, could halt further gains. Surpassing this, the pair could jump to test the 1.7495 obstacle ahead of 1.7614. If buyers persist, the peaks of 1.7727 and 1.7793 may attract traders’ attention.
If sellers reverse the price back down below the 1.7133 level, initial support could come at the 61.8% Fibo of 1.7062, while lower a tough support region from 1.6900 to 1.6835 could challenge the bears. The area consists of a past support level, the 200-day SMA and the 50.0% Fibo. Penetrating below could test the 50-day SMA at 1.6724 and the nearby 1.6700 hurdle ahead of the 38.2% Fibo of 1.6608.
In brief, a short-term neutral-to-bullish bias holds above the 200-day SMA and a definitive close above 1.7133 would strengthen it.


