
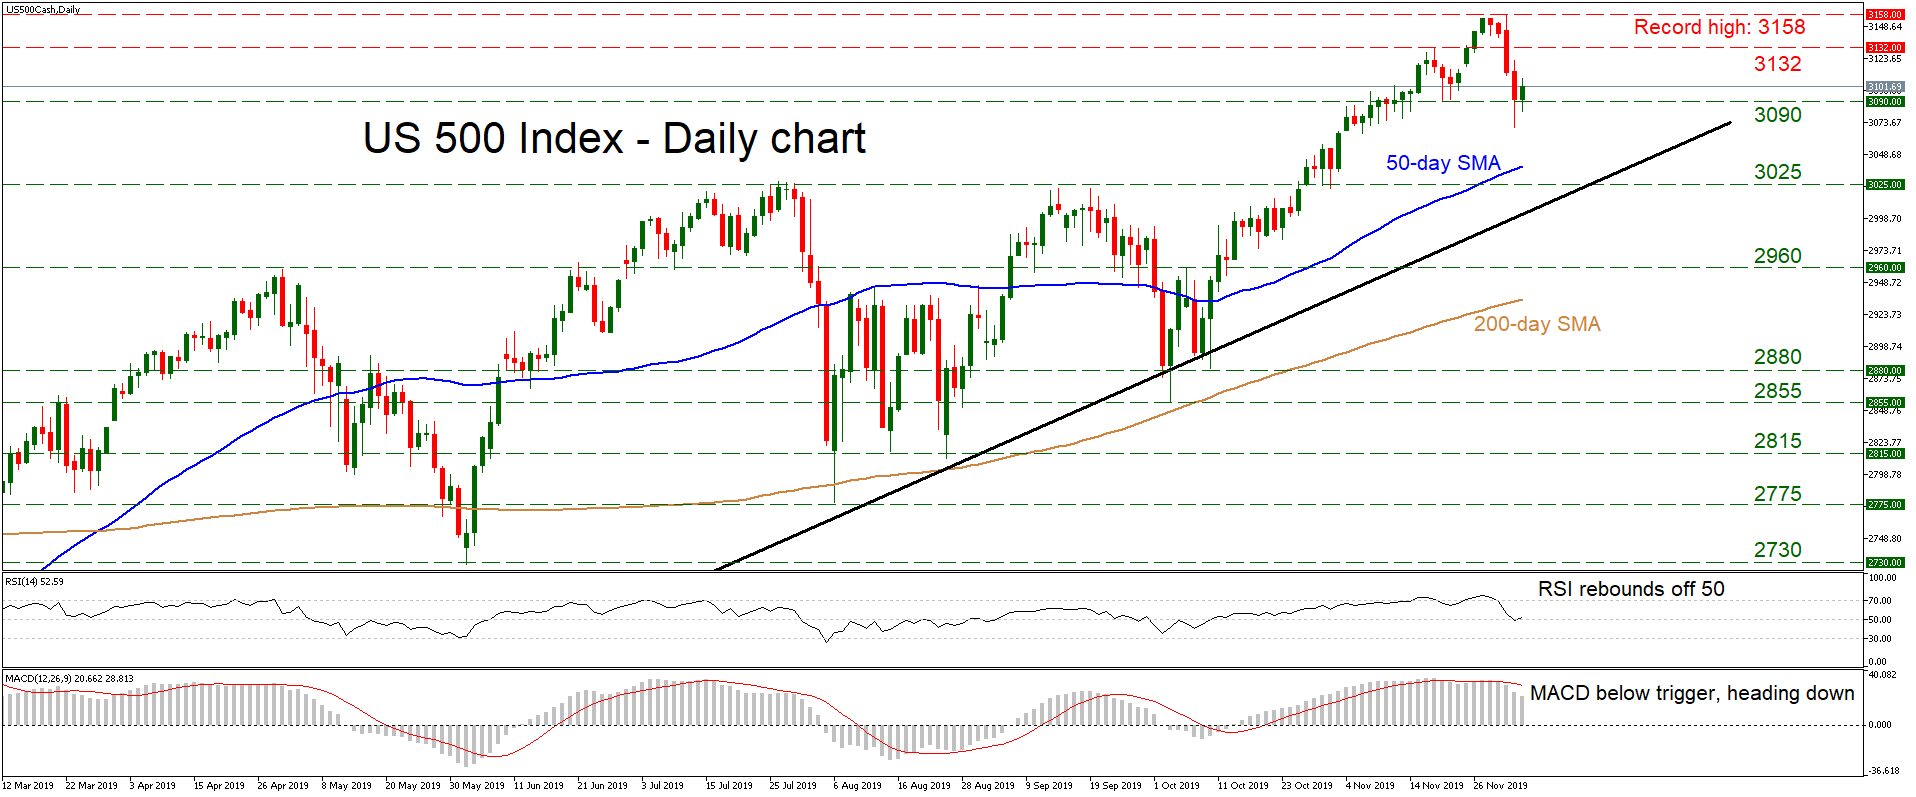
The US 500 index fell this week, after briefly touching a new all-time high of 3158. The picture is still positive, with the price structure consisting of higher peaks and higher troughs above a long term uptrend line drawn from the December 2018 low, and also safely above both the 50- and 200-day simple moving averages (SMAs). That said, a potential close below 3090 would mark a lower low on the daily chart, bringing the bullish outlook into question.
Short term oscillators paint a mixed picture. The RSI rebounded off its 50 line and is pointing up, but the MACD – although still positive – has slipped below its red trigger line and looks to be headed for zero.
If the bears retake the wheel, their first target may be the 3090 zone. A clear break underneath would turn the bias to a more neutral one, opening the way for the cluster of support around the 50-day SMA at 3039, the 3025 level, and the uptrend line. If sellers pierce below this congested territory too, that could turn the short term bias to negative, shifting the focus to 2960.
On the upside, a recovery could stall near 3132, which halted the advance on November 19. If the bulls pierce above, the all-time high of 3158 would come on the radar next. Another positive break would send the index into uncharted waters again, with the next levels to offer resistance likely being psychological figures, such as 3200 initially.
In short, the picture is still positive despite the recent pullback. A close below 3090 is required to cast doubt on that.


