
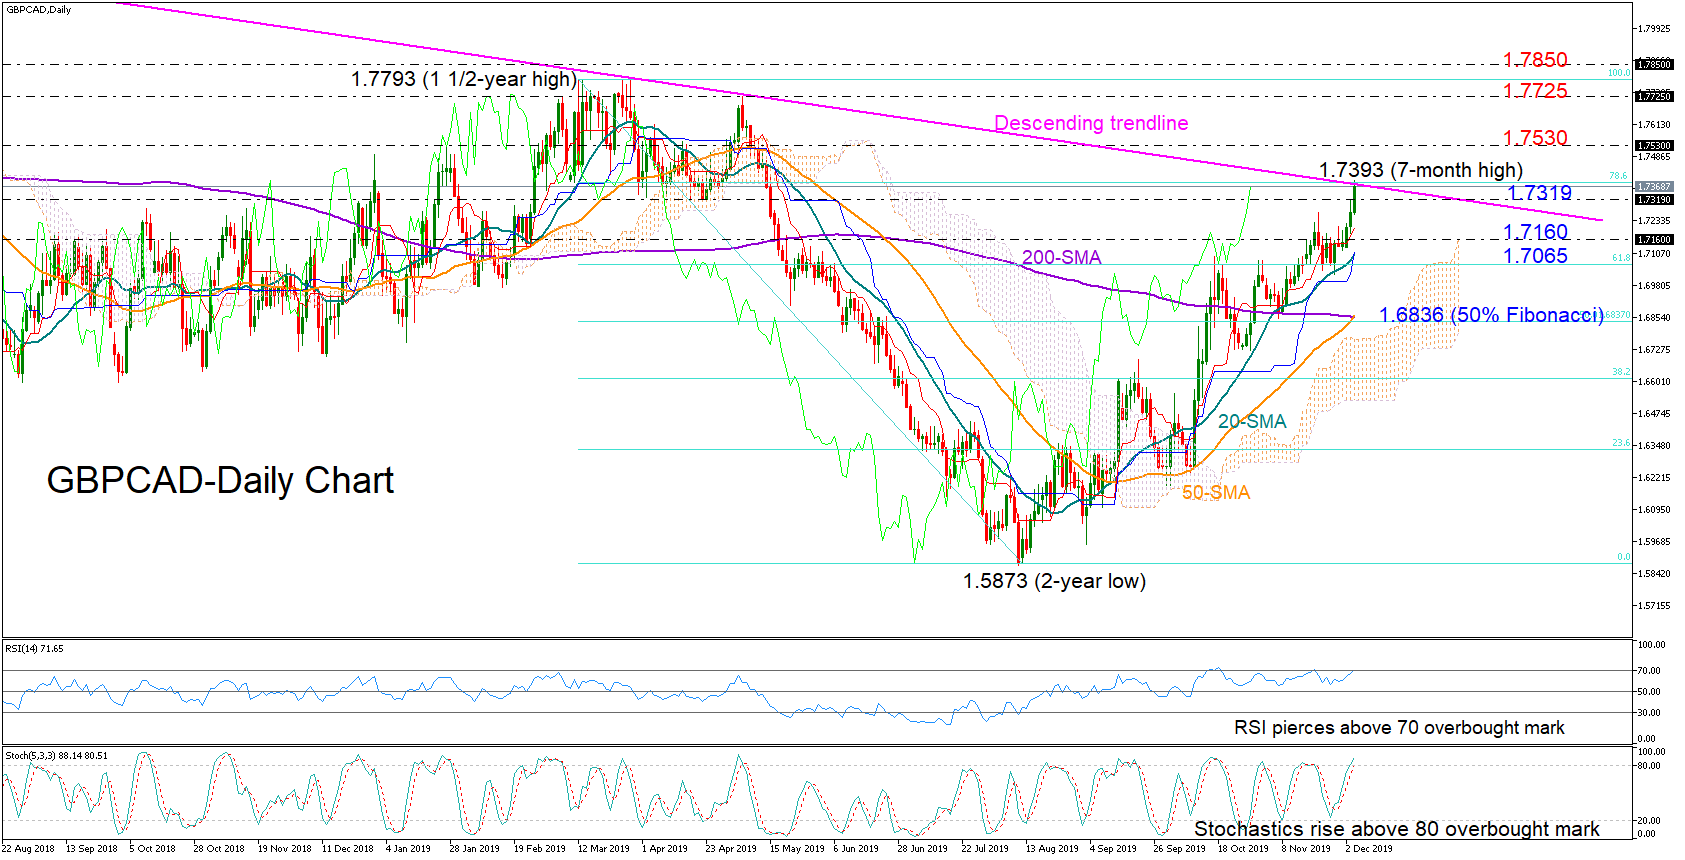
GBPCAD gained further positive traction on Wednesday and unlocked a fresh 7-month high of 1.7393.
It seems that there is more bullish fuel in store, though at a limited amount as the RSI and the Stochastics are moving into overbought waters and the price itself is trading near a resistance trendline that joins the peaks since March 2018. A complete bearish cross between the 50- and the 200-day SMAs could turn medium-term traders cautious too.
In case the price returns below the 1.7319 barrier, the downfall could extend towards 1.7160. Slightly lower the 61.8% Fibonacci of 1.7065 of the downleg from 1.7793 to 1.5873 could next come in defense. If the latter proves easy to get through, support could then run down to the 50% Fibonacci of 1.6836.
A significant rally above the descending trendline could initially stall around the 1.7530 level that has been challenging the bulls for more than two years now. Above that block the bulls would aim to clear the 1.7725-1.7793 zone to resume the positive outlook in the bigger picture. Slightly higher, the 1.7850 mark which strongly rejected upside corrections in 2017 should attract attention too.
Summarizing, the odds for a downside correction in the short-term seem to be increasing in the GBPCAD market, while the positive trend in the medium-term window could also come under review.


