
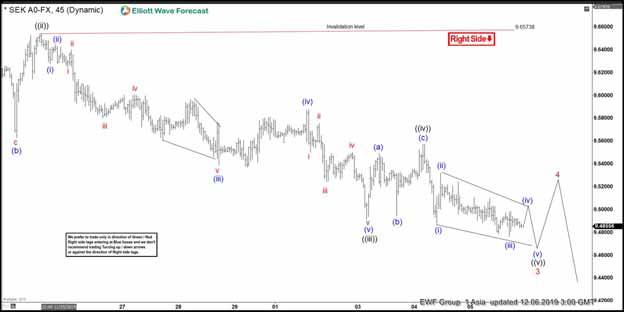
Short-term Elliott Wave view in USDSEK suggests that the decline from November 13, 2019 peak is unfolding as a 5 waves impulsive Elliott Wave structure. On the Chart below, the lesser degree wave ((ii)) bounce of an impulse structure ended at $9.6573 high. Down from there, wave ((iii)) lower is also unfolded in a lesser degree 5 wave structure. When wave (i) ended at $9.7269 low, wave (ii) ended at $9.6445 high. Wave (iii) ended at $9.5388 low, wave (iv) ended at $9.5880 high and wave (v) ended at $9.4912 low.
Up from there, wave ((iv)) bounce unfolded as zigzag structure where wave (a) ended at $9.5493 high. Wave (b) pullback ended at $9.4943 low and wave (c) ended at $9.5573 high. Below from there, wave ((v)) lower remains in progress as a diagonal structure looking to extend lower 1 more push towards $9.4750-$9.4495 inverse 1.236%-1.618% Fibonacci extension area to end wave 3 of an impulse structure. Afterwards, the pair should do a wave 4 bounce in 3, 7 or 11 swings to correct the decline from November 20, 2019 peak before resuming lower again. We don’t like buying the pair as the right side tag is red lower & calling for more downside.
USD/SEK 1 Hour Elliott Wave Chart


