
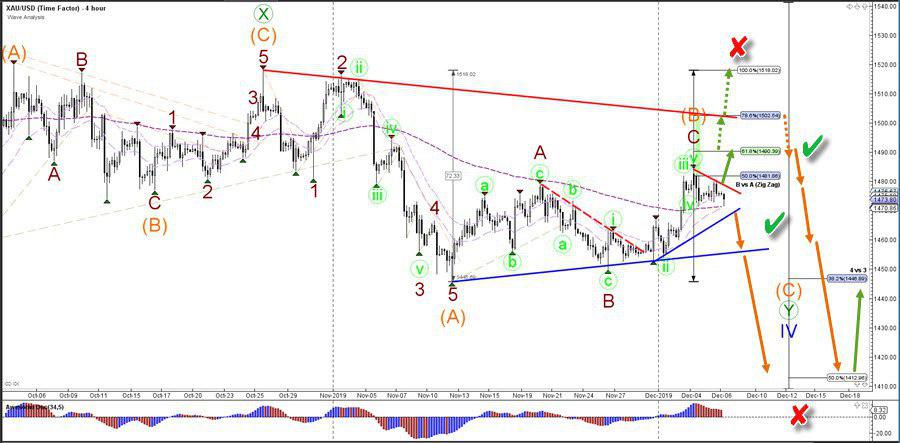
The XAU/USD seems to be building a bullish ABC (dark red) pattern within a wave B (orange) of a larger ABC (orange) pattern. A bearish bounce and breakout (green checks) could confirm this wave outlook whereas a bullish breakout above the 100% Fib makes this unlikely (red x). The main turning spot is expected to be the 61.8% Fibonacci level of wave B vs A. A bearish continuation could complete wave C (orange) of wave Y (green) of wave 4 (blue).
The XAU/USD could be in wave 4 (green) correction as long as the price stays above the 61.8% Fibonacci level of wave 4 vs 3 otherwise price is invaliding (red x) the pattern. A bullish breakout above the resistance trend line (red) could confirm (green check) the bullish move up towards the Fib targets. A bearish bounce at the targets could, however, indicate the end of the bullish correction and start of a larger bearish push.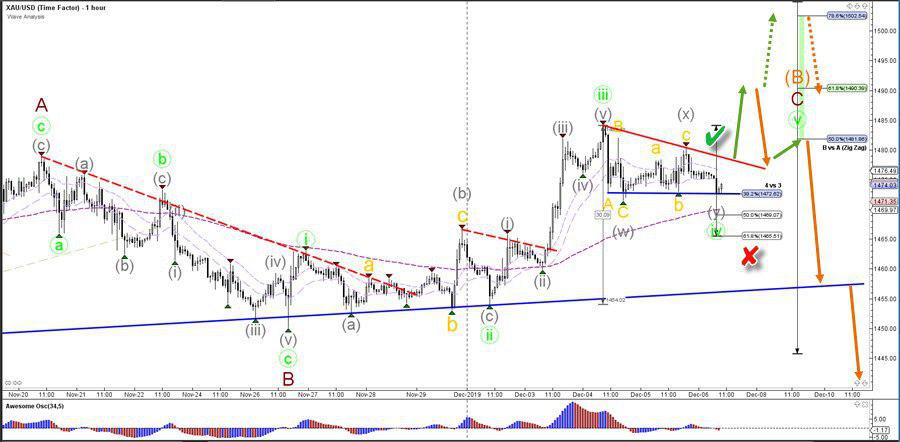


")
