
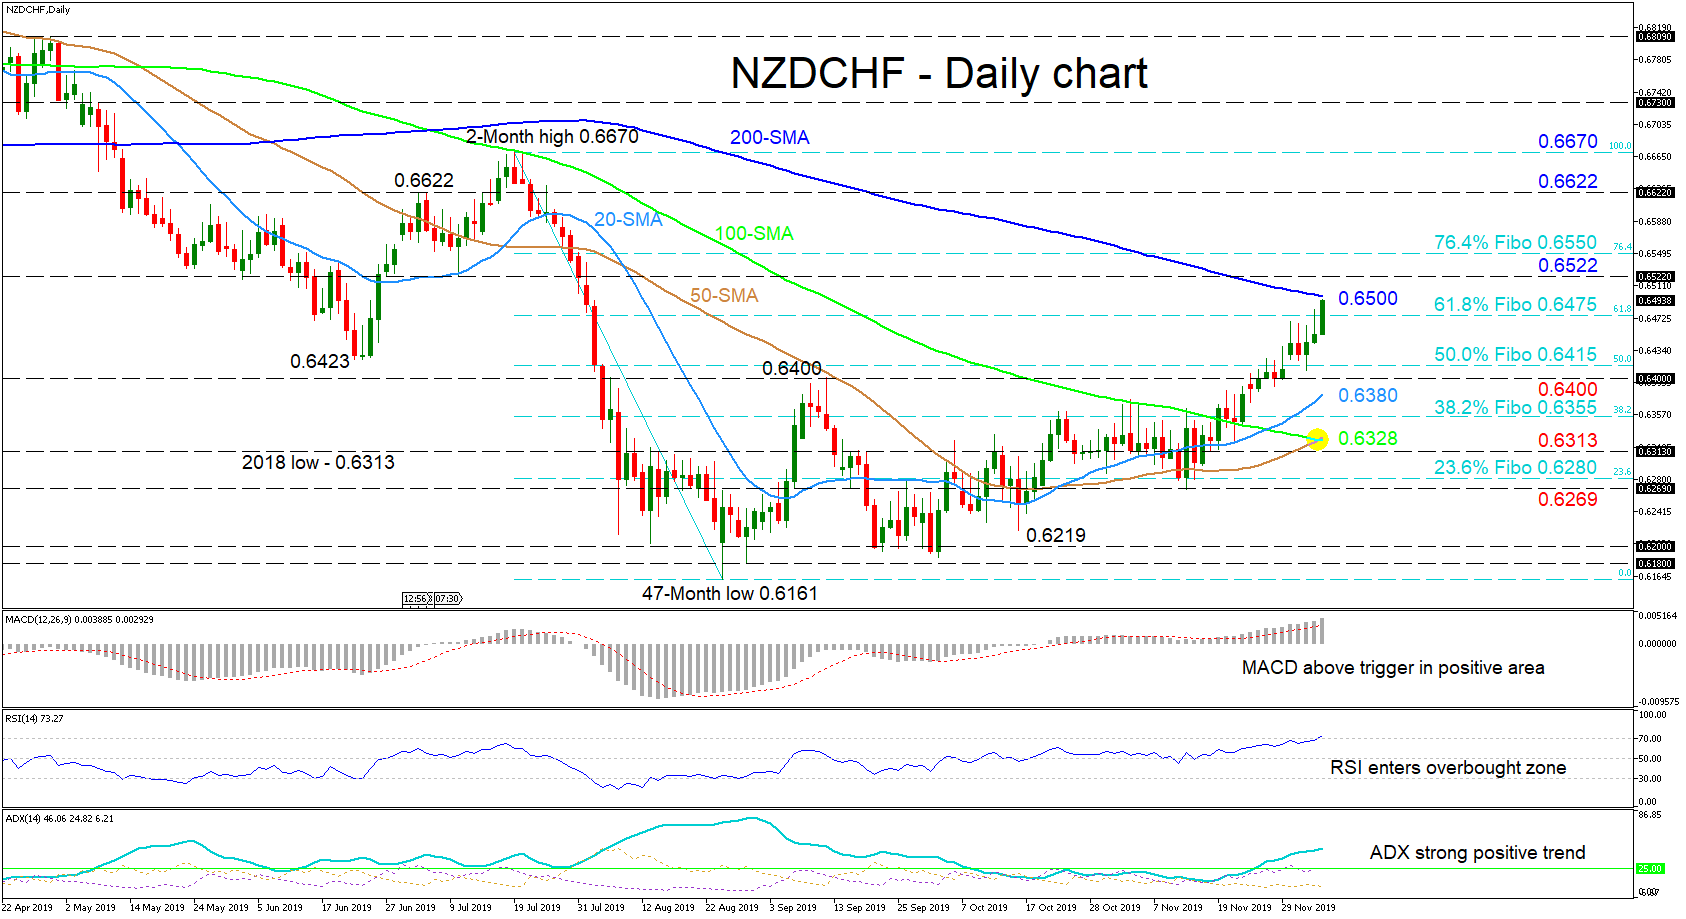
NZDCHF is nearing the 200-day simple moving average (SMA) after buyers drove the price up from the 0.6280 level – which is the 23.6% Fibonacci retracement of the down leg from 0.6670 to 0.6161 – and past various restricting obstacles.
The recent climb seems to be backed by positive signals from the technical indicators and the bullish crossovers of the 100-day SMA by the upward sloping 20- and 50-day SMAs. The MACD, in the positive zone, is increasing above its red trigger line, while the RSI is rising and has just entered the overbought territory. Furthermore, the ADX presents a strong positive trend in place.
If buyers keep up, first to halt the ascent is the tough 200-day SMA presently at 0.6500. Overcoming the MA, the 0.6522 inside swing low from July 10 could restrict the push higher to test the 76.4% Fibo of 0.6550. If overrun, the high from July 4 and two-month peak of 0.6670 could be next to enter the spotlight.
Alternatively, if sellers pivot the price at the 200-day SMA area and below 0.6475, the 50.0% Fibo at 0.6415 and 0.6400 support beneath could challenge the bears ahead of the 20-day SMA at 0.6380. Steering lower, the 38.2% Fibo of 0.6355 may interrupt the test of the region of 0.6328 to 0.6313, where the bullish cross and 2018 low reside. Conquering this as well, could see the trough low area of 0.6269 be revisited.
Summarizing, the short-term bullish bias remains intact as the positive signals display no signs of receding.


