
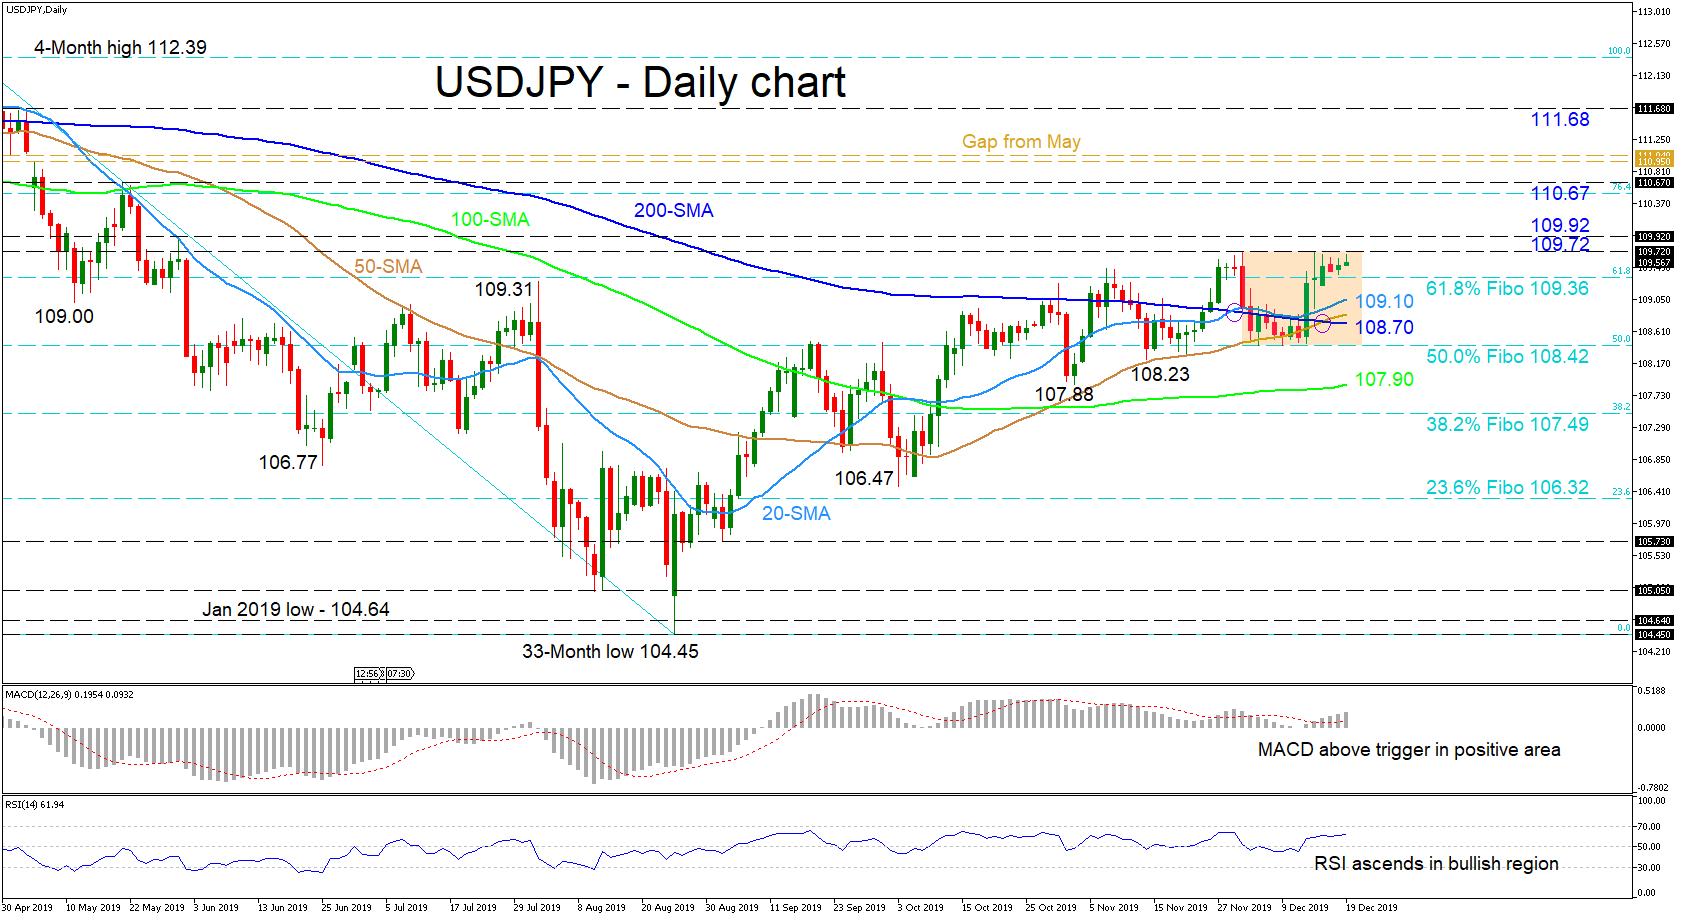
USDJPY seems to be bound between the 109.72 and 108.42 level, which happens to be the 50.0% Fibonacci retracement of the down leg from 112.39 to 104.45. The pair seems to have hit a wall at the 109.72 barrier, after the price pushed off the lower boundary of 108.42 and was further boosted by the upward sloping bullish crossovers of the 200-day simple moving average (SMA).
The short-term oscillators suggest a stall in positive momentum but lean towards an improving picture. The MACD is above its red trigger line in the positive region, while the RSI is marginally rising, mid-way in bullish territory.
To the upside, immediately restricting further gains is the 109.72 upper boundary of the consolidation area and nearby high of 109.92 from May 30. Overrunning these, the pair may resume its climb and head for the 110.67 swing high from May 21. Next comes an encounter with the gap from back in May, of 110.95 to 111.04, which if surpassed could stretch the pair up towards the 111.68 resistance.
If sellers resurface and steer below the 61.8% Fibo of 109.36, a tough support region from 109.10 – 108.70 involving the 20-, 50- and 200-day SMAs could obstruct the test of the lower bound of 108.42. Diving beneath 108.42, the 108.23 low and 100-day SMA at 107.90 could impede the drop towards the 38.2% Fibo of 107.49. Overcoming this too, the 106.47 trough and 23.6% Fibo of 106.32 could move into the spotlight.
In brief, a neutral-to-bullish bias continues to exist in the short-term and a break above 109.92 or below 108.42 would reveal the next direction.


