
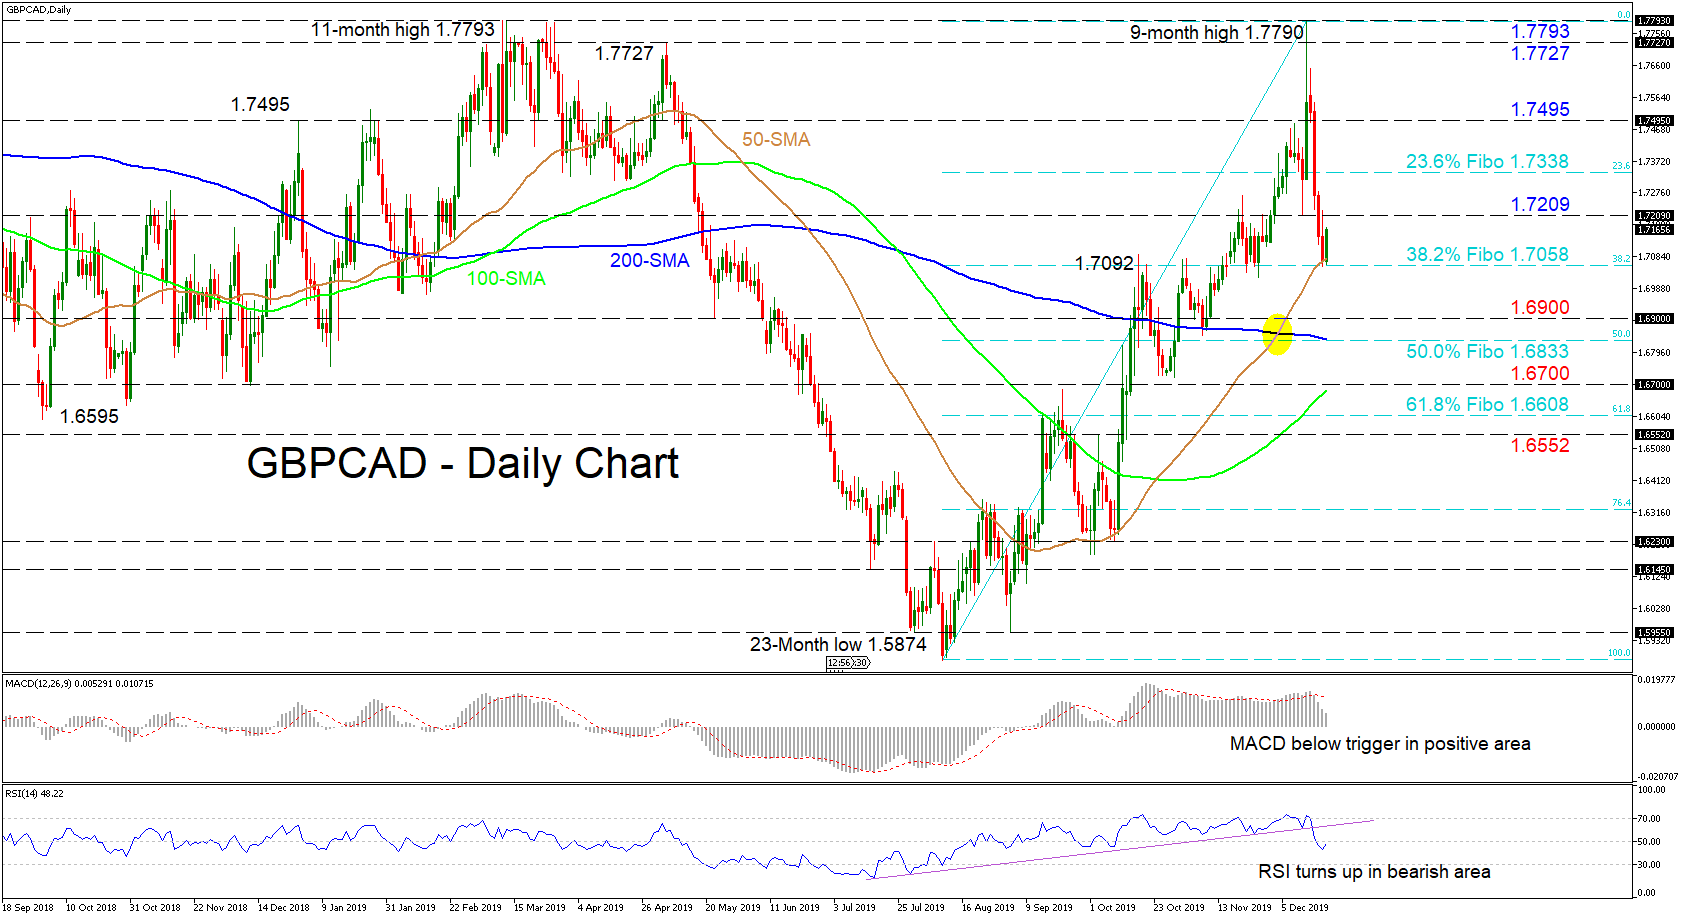
GBPCAD’s aggressive reversal marginally ahead of the previous high from March 12 of 1.7793 has come to a standstill at the 1.7058 level – which is the 38.2% Fibonacci retracement of the up leg from 1.5874 to 1.7790 – that previously restricted further advances in the pair.
The short-term oscillators reflect conflicting signals in directional momentum. The MACD has dropped far below its red trigger line but remains in the positive zone, while the RSI has dipped below its neutral mark but is showing signs of a slight improvement. The still upward sloping 50- and 100-day simple moving averages (SMAs) as well as the bullish crossover of the 200-day SMA continue to support a positive picture.
To the upside, buyers could face initial downside pressure from the 1.7209 inside swing low of December 12. Climbing higher, the 23.6% Fibo of 1.7338 could prevent further advances towards the 1.7495 resistance. If buyers persist, a revisit of the 1.7727 high from May 6 and nearby peaks of 1.7790 and 1.7793 could unfold.
If sellers manage to drive the price back down and below the 38.2% Fibo of 1.7058 – where the 50-day SMA also resides – the pair could resume the decline, reaching until the 1.6900 handle and 200-day SMA located at the 50.0% Fibo of 1.6833 underneath. A successful breach could see the 1.6700 barrier and 100-day SMA test the bears’ efforts ahead of the 61.8% Fibo of 1.6608.
Overall, the short-term maintains its positive bias above 1.7058, while a break below 1.6833 could reinforce belief in a negative picture.


