
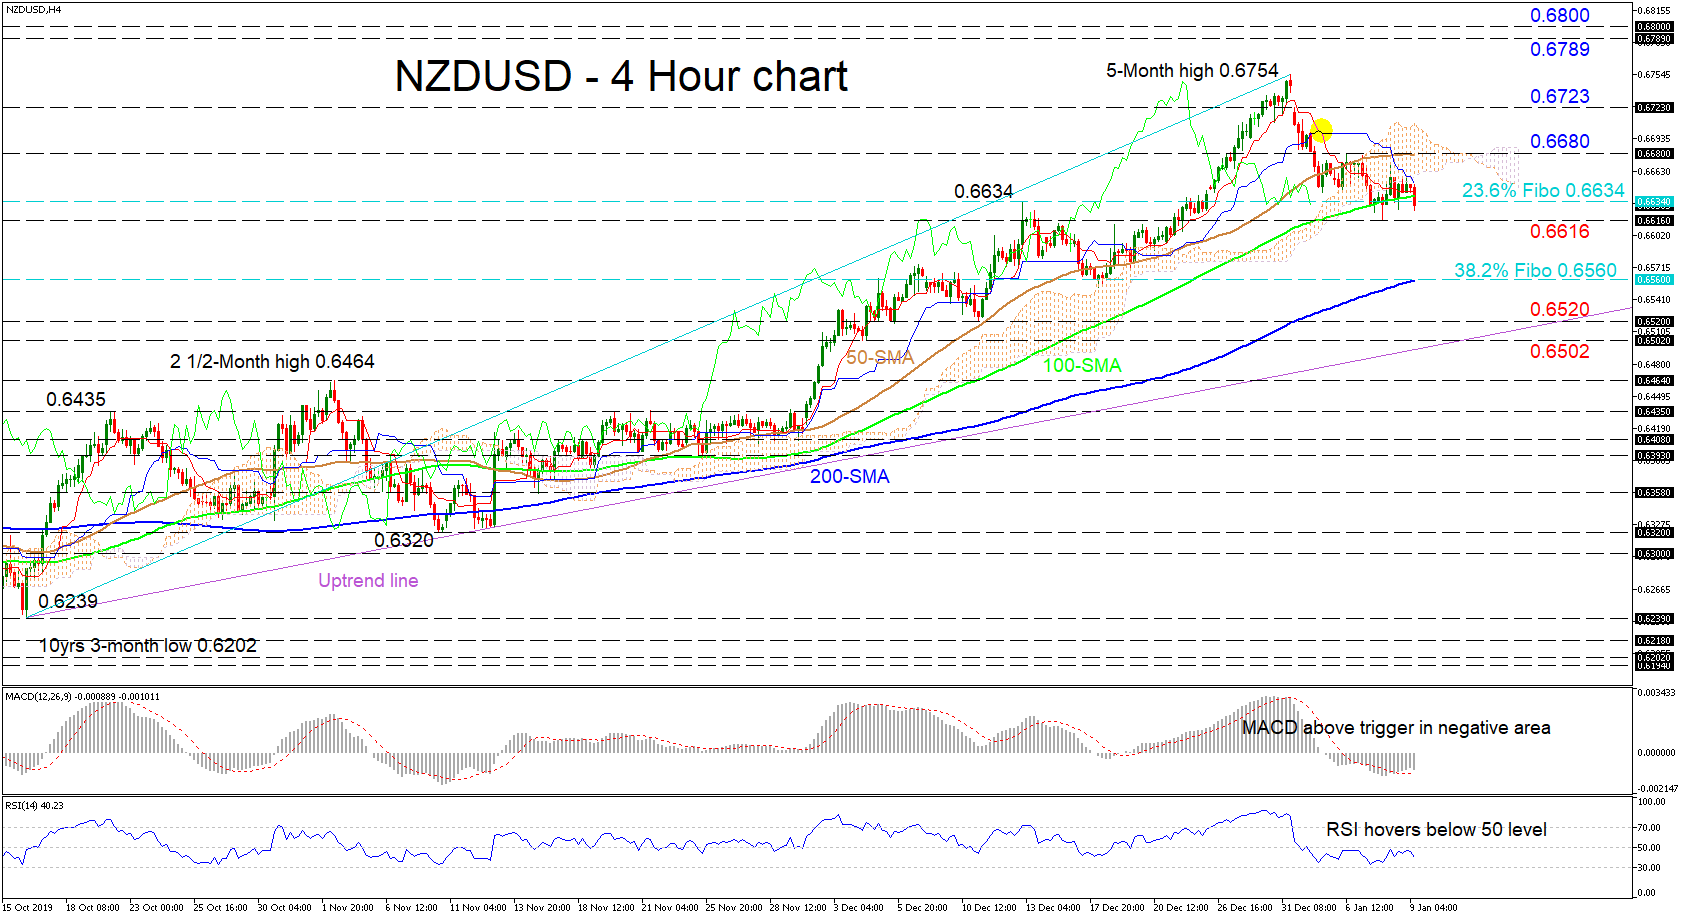
NZDUSD looks to have turned flat, confined between 0.6680 and 0.6616 over the last week, following the decline from the five-month high of 0.6754 for the end of 2019. The pair has found support within this range from the 0.6634 area, which is the 23.6% Fibonacci retracement of the up leg from 0.6239 to 0.6754 and where the 100-period simple moving average (SMA) currently is located.
That said, the short-term oscillators suggest that negative momentum may be picking up. The MACD, although above its red trigger line in the negative zone, looks to reclaim it, while the RSI, hovering below the 50 level, has started to drop. Further backing this view is the slight flattening in the 50-period SMA and the still intact bearish crossover within the Ichimoku lines.
If sellers manage to steer the pair below the 23.6% Fibo of 0.6634 and fresh low of 0.6616, the bears could then face another fortified support at the 38.2% Fibo of 0.6560, where the 200-period SMA also lies. Breaching this trough, the price could test the swing lows in the region of 0.6520 to 0.6502, which also encompasses the uptrend line drawn from October 16.
To the upside, if buyers guide the price above the Ichimoku lines, the 0.6680 barrier – where the flat 50-period SMA also is located – could prevent the bulls from reaching the 0.6723 resistance and 2019 high of 0.6754. Conquering this level could propel the pair towards the 0.6789 peak of 19 July 2019 and 0.6800 high from April 2019.
Overall, the very short-term bias is neutral for now, with a break either above 0.6680 or below 0.6616 revealing the next direction.


