
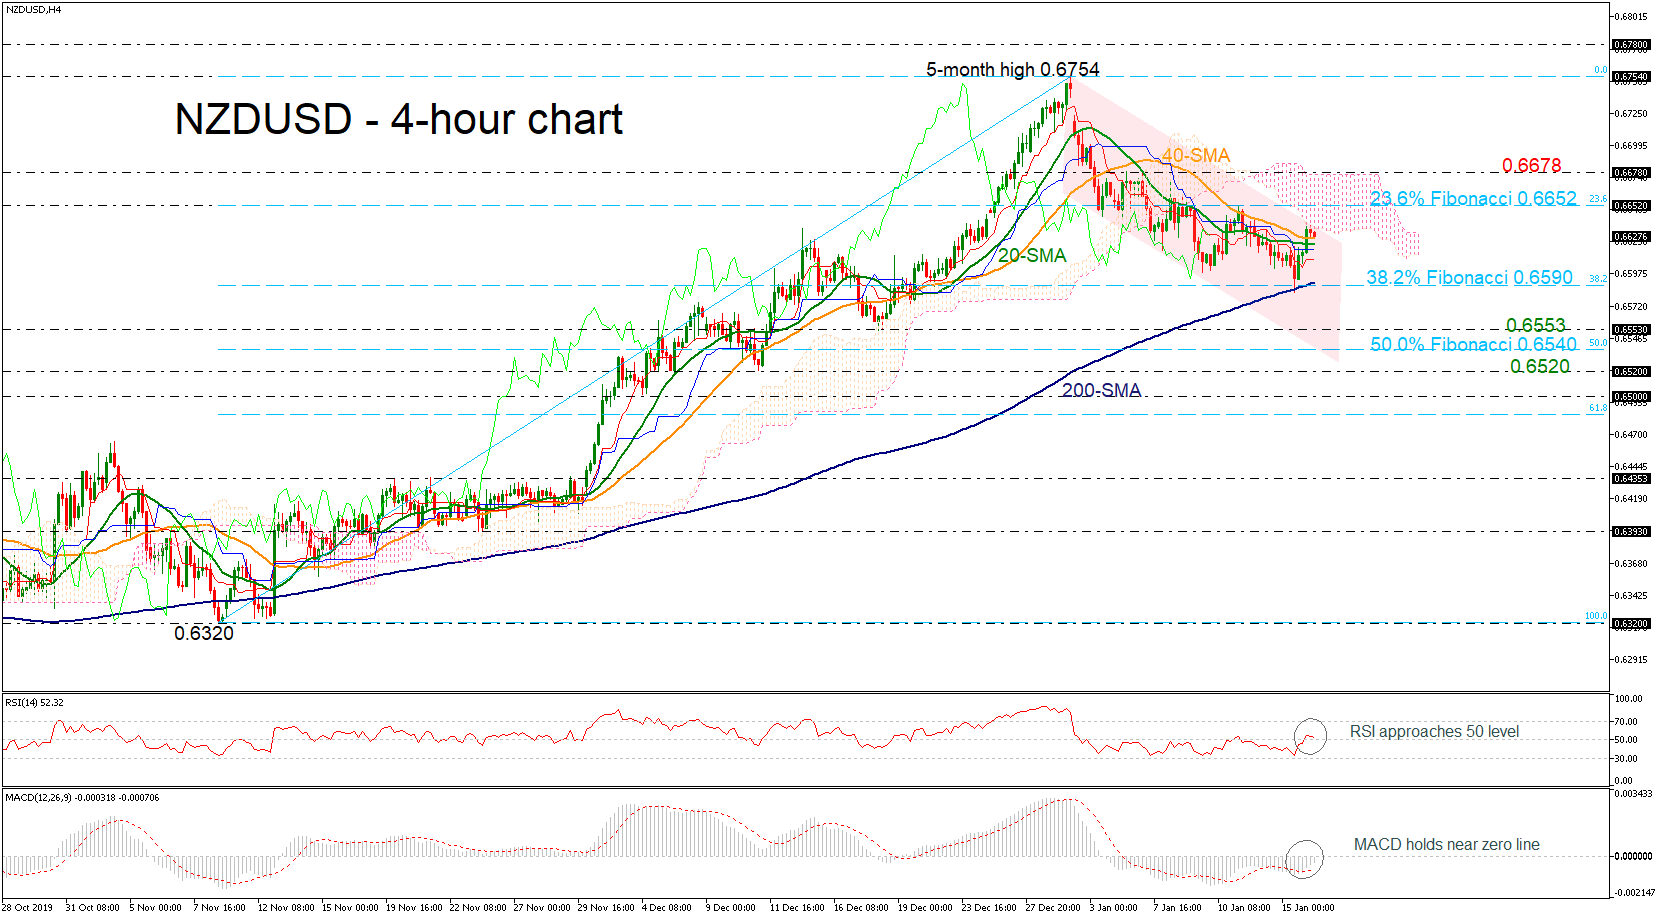
NZDUSD traded with losses over the last two weeks, following the pullback off the five-month high of 0.6754 and now, it is creating a downward sloping channel.
Currently, the price is trading slightly above the short-term simple moving averages (SMAs) near the return line of the channel. The RSI on the 4-hour chart is missing direction in positive area, while the MACD oscillator is moving higher, approaching the zero line. Also, the red Tenkan-sen keeps flattening below the blue Kijun-sen line, reducing chances for a meaningful recovery in the short-term.
However, should the price close comfortably below the 20-period moving average (SMA) at 0.6620, that could push the market down to 0.6590, which is the 38.2% Fibonacci of the upleg from 0.6320 to 0.6754 and which overlaps with the 200-period SMA. Even lower, the 0.6553 support and the 50.0% Fibo of 0.6520 could attract sellers’ attention.
On the other side, an upward break of the descending channel could open the door for the 23.6% Fibo of 0.6652, which stands inside the Ichimoku cloud. More upside pressures could hit the upper surface of the cloud at 0.6678.
In brief, NZDUSD is in bearish mode in the very short-term timeframe and bullish in the bigger picture.


