
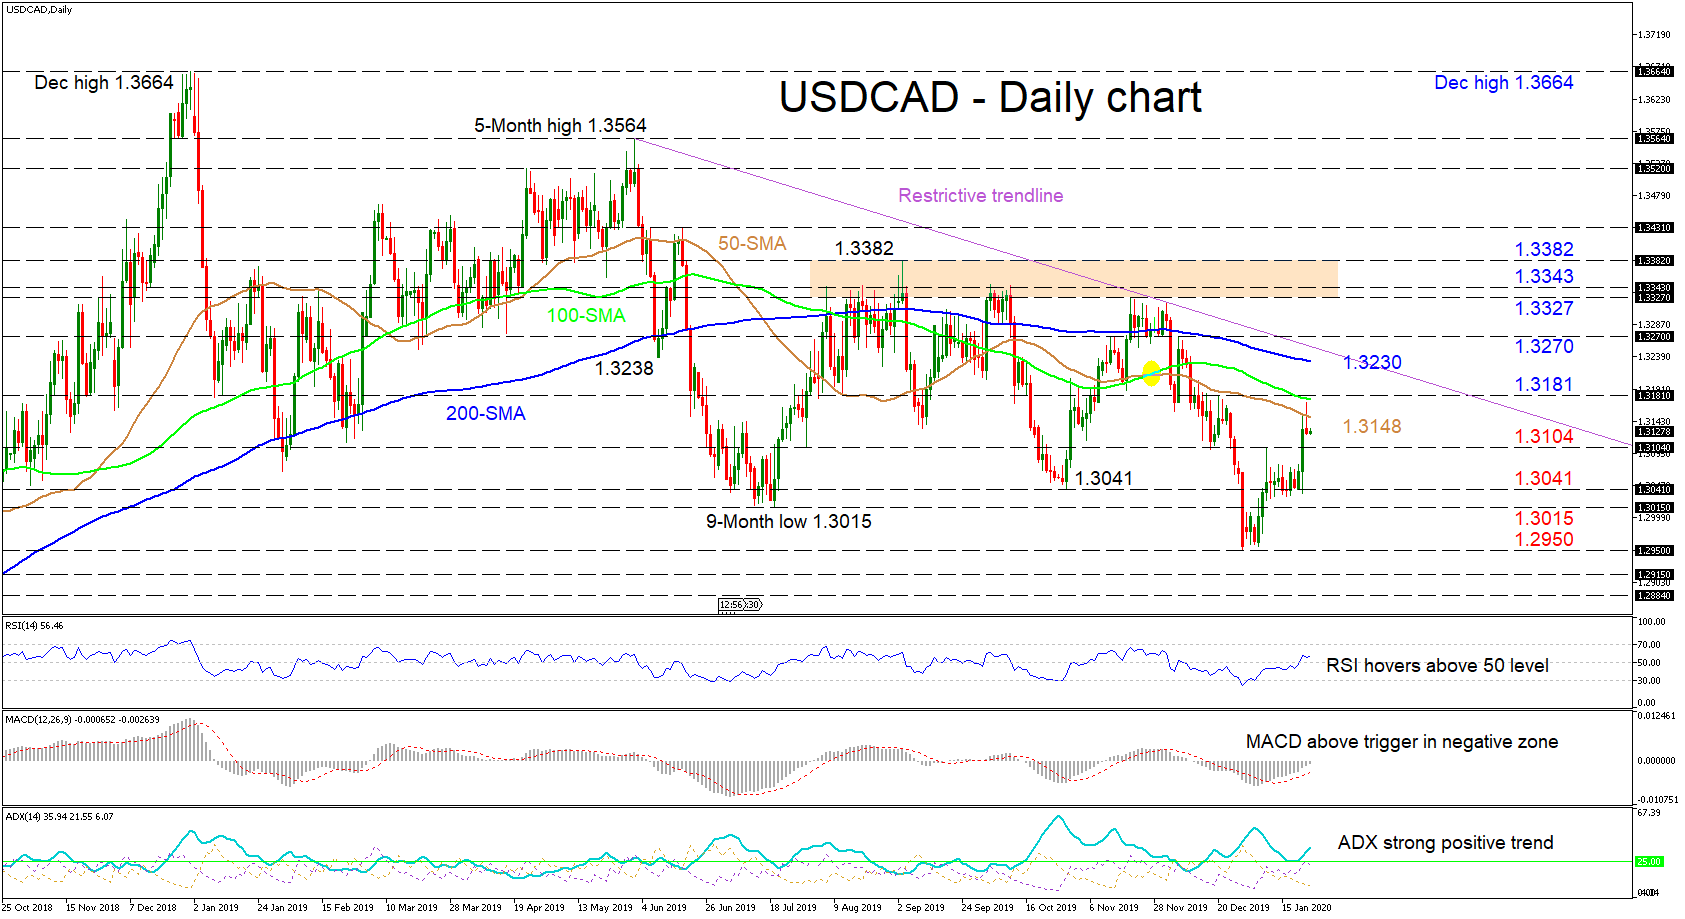
USDCAD recent push up from the 1.2950 low looks to be capped by the 50- and 100-day simple moving averages (SMAs) with sellers pushing back down. Aiding the negative picture is the restrictive trendline and all the SMAs, which are sloping downwards.
That said, for now, reflecting conflicting signals are the short-term oscillators that suggest that positive momentum is present. The MACD is increasing above its red trigger line in the negative region and it has reached its zero mark, while the RSI is hovering slightly above the 50 level. Additionally, the ADX displays that a short-term positive trend is still in place.
With the SMAs limiting upside corrections, if sellers succeed in propelling the price lower, initial support comes from the 1.3104 level. Steering downwards, the 1.3041 and 1.3015 lows from 29 October and 12 July 2019 respectively, could prevent the bears from reaching the 1.2950 fresh trough.
If buying interest picks up, immediately obstructing the pairs ascent, is the 50-day SMA at 1.3148 and the nearby high of 1.3181, coupled with the 100-day SMA. Clearing this obstacle, the 200-day SMA at 1.3230 could impede the climb with the limiting trendline and the 1.3270 swing high overhead, challenging buyers’ efforts to conquer the region. Overcoming this, the 1.3327 to 1.3343 area of tops, may deny the 1.3382 peak from being reached.
In brief, the short-term bias may sustain its bearish nature if it remains below the 50- and 100-day SMAs and the preventive trendline, with a break below 1.2950 boosting the downside move.


